Bitcoin Defends 70K as DXY Reversal Signal Creates Short-Term Inflection Point
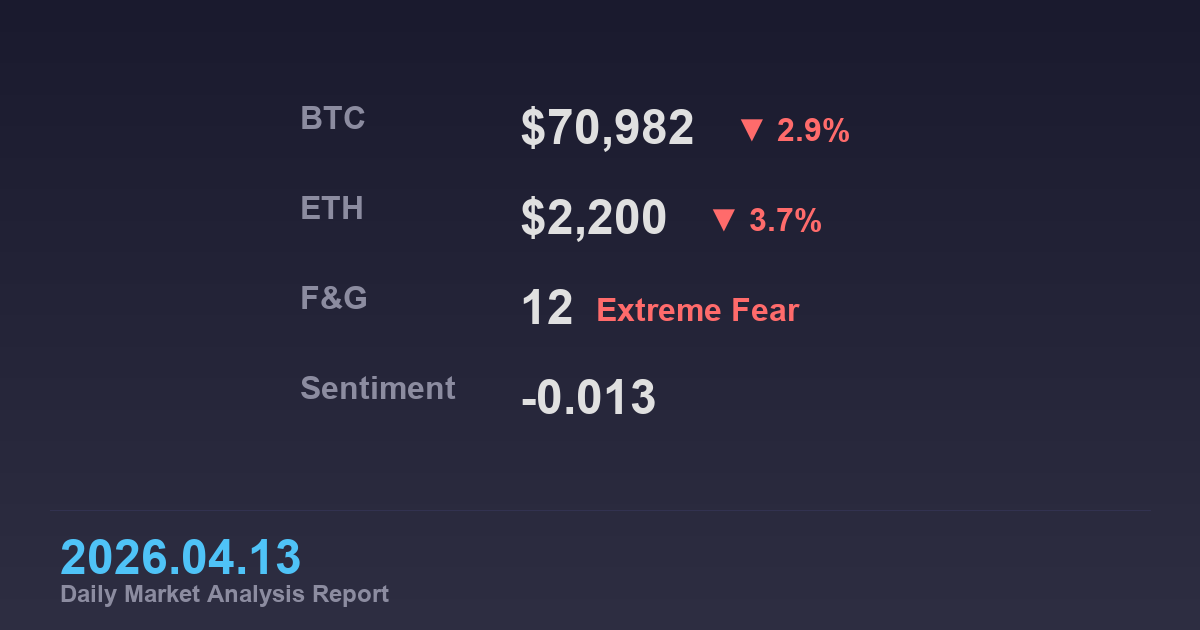
Bitcoin is defending near $70,000. With conflicting signals from DXY's bullish reversal pattern and exchange net outflows, we examine the short-term inflection point. The Fear and Greed Index is at 12 (Extreme Fear), indicating cooled market sentiment.
Why this matters today
BTC’s Bat pattern and exchange net outflows support short-term upside momentum
DXY’s strong reversal signal acts as a major headwind variable for BTC’s rise
Market sentiment (Extreme Fear) creates an environment that may seek rebound opportunities
Bitcoin: reading the main chart
BTC Defends 70K as Bat Pattern Suggests Bullish Reversal
Bitcoin is currently trading around $70,982, near the midpoint of its 7-day range ($68,800 – $73,107). Chart analysis identifies a Bat pattern (a harmonic pattern suggesting bullish reversal after point A), showing short-term upside signals with a confidence of 0.7. This pattern implies potential continuation of the uptrend.
Technical levels show resistances at $76,000, $72,000, and $70,000 in order of strength, with supports at $66,000 and $65,000 as key. The current price near the $70,000 resistance will determine short-term direction.
Additionally, exchange BTC net outflows at -18,057 BTC (7-day) suggest easing spot selling pressure. Funding rates (BTC -0.0002%) are neutral, and momentum (+0.0297) has turned slightly positive, potentially supporting upward movement.
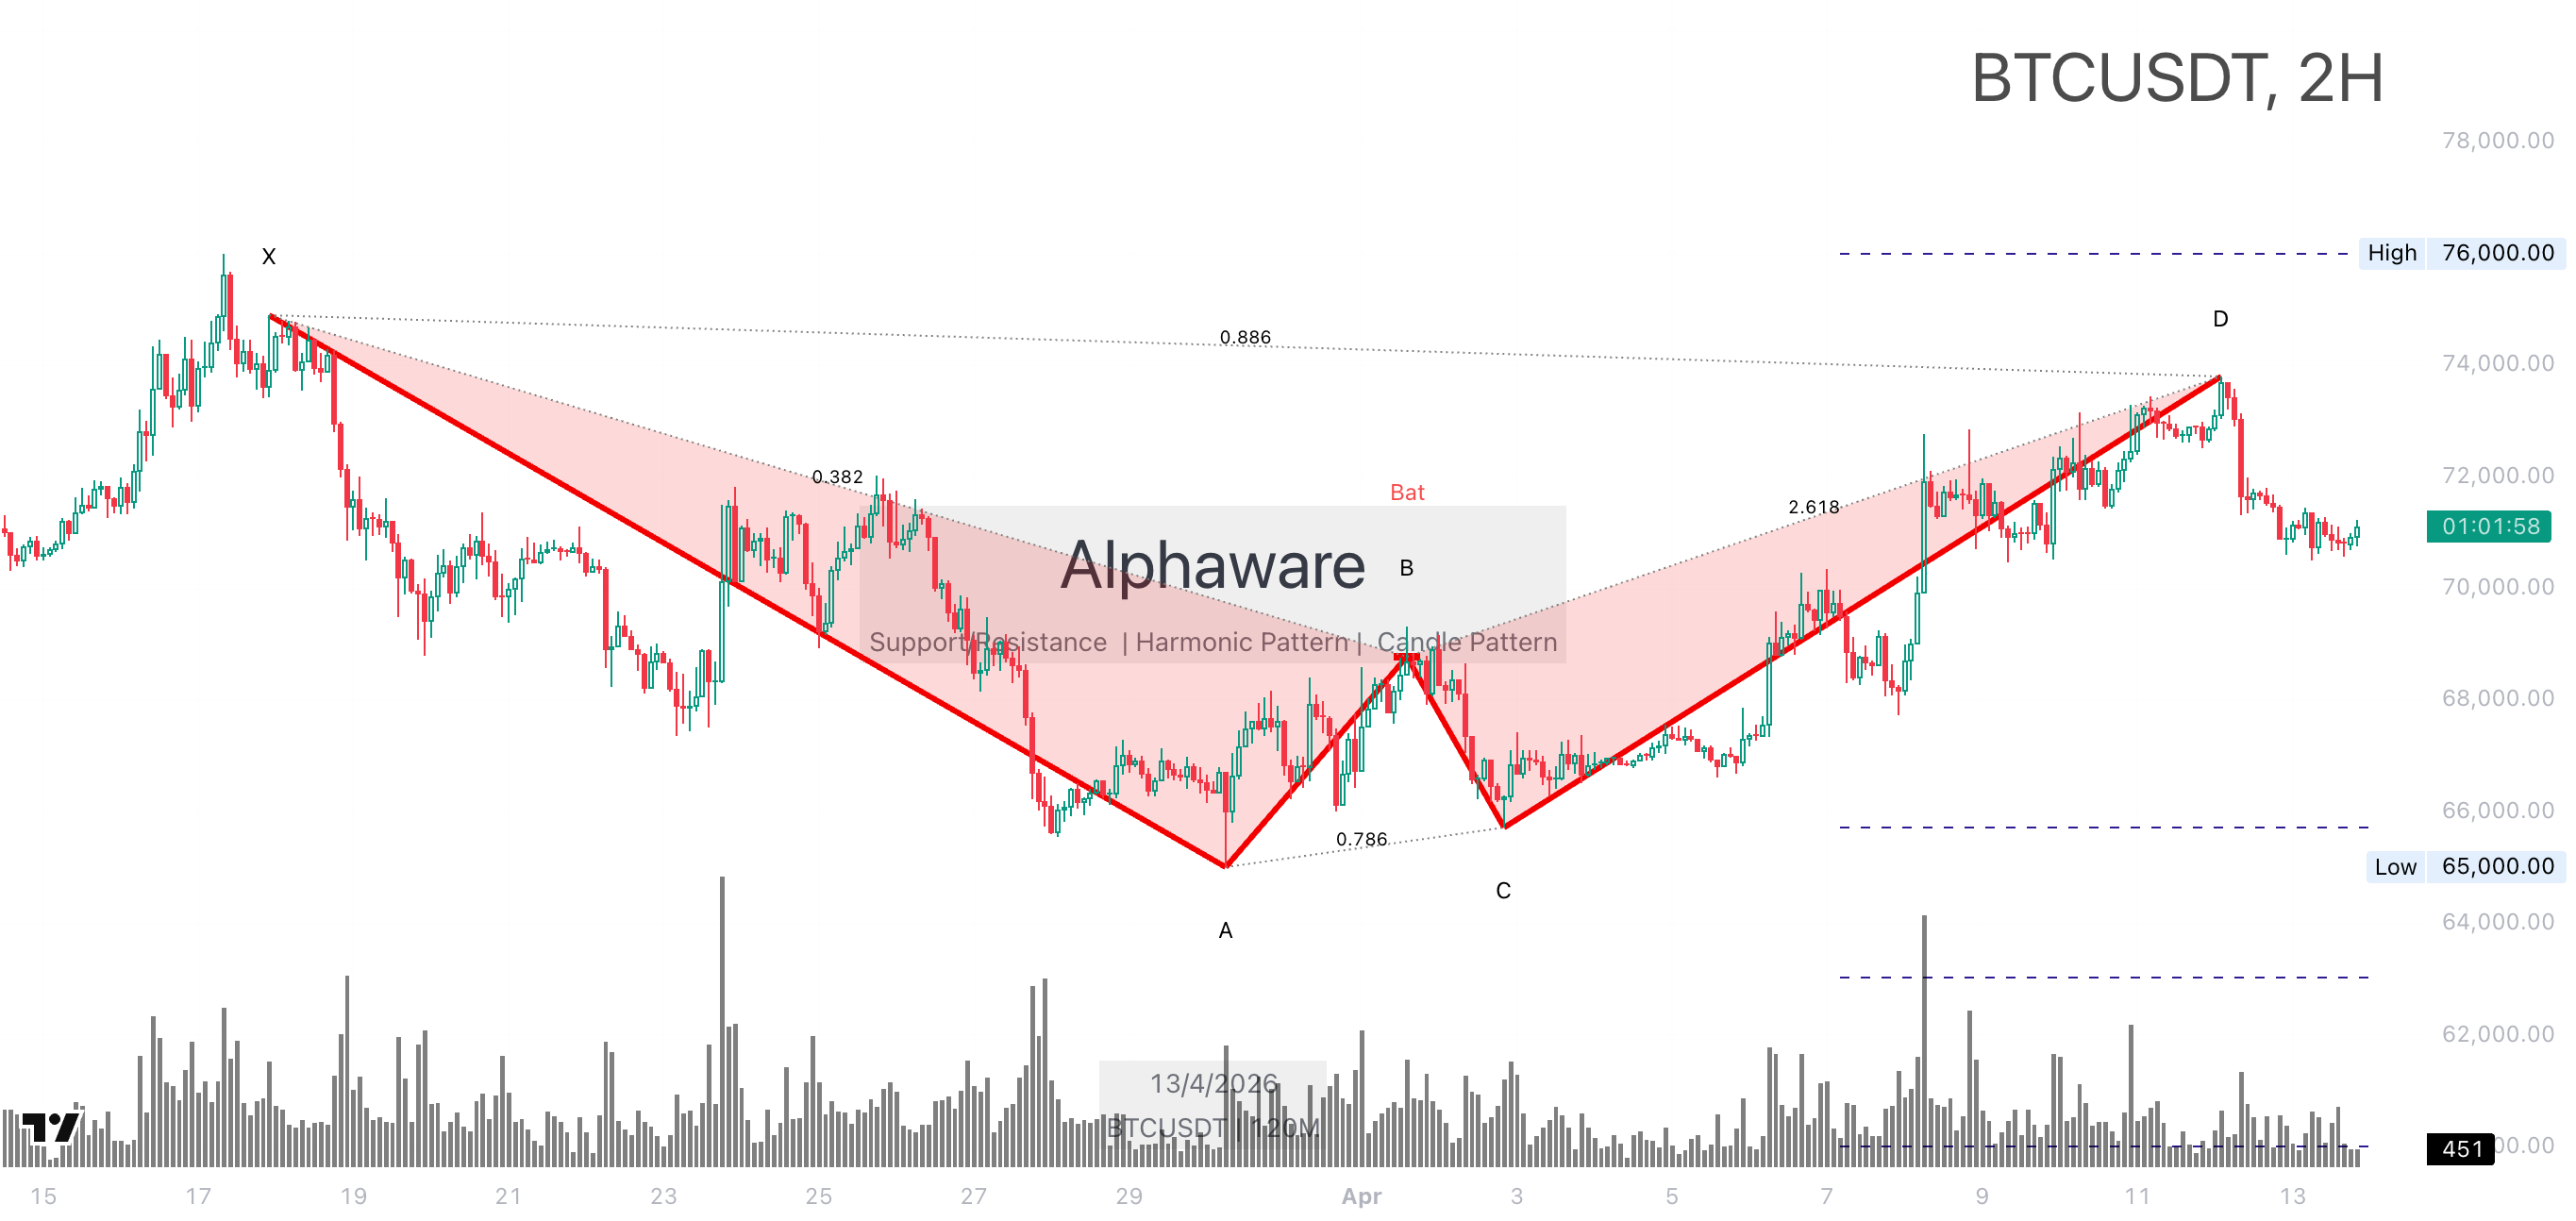 BTC Bat pattern suggests bullish reversal, testing $70,000 resistance
Cross-asset confirmation
ETH near 2.2K is still behaving like a BTC beta trade
ETH is trading near $2,200 and is down roughly 3.7% over the past week, keeping it directionally aligned with BTC. Unlike BTC, the current snapshot does not show a comparably clear standalone harmonic reversal. That makes ETH look less like an independent leader and more like a secondary asset following Bitcoin’s next move.
ETH funding is effectively flat at 0.0000%, which suggests positioning is not crowded enough to force an immediate squeeze in either direction. In practice, that means ETH likely needs BTC to reclaim the 70K area cleanly before a stronger relief move becomes credible.
If BTC stabilizes and pushes through resistance, ETH can retest the 2.25K-2.3K zone. If BTC fails at resistance and DXY strengthens, ETH is more likely to remain comparatively weak and revisit lower support inside the current range.
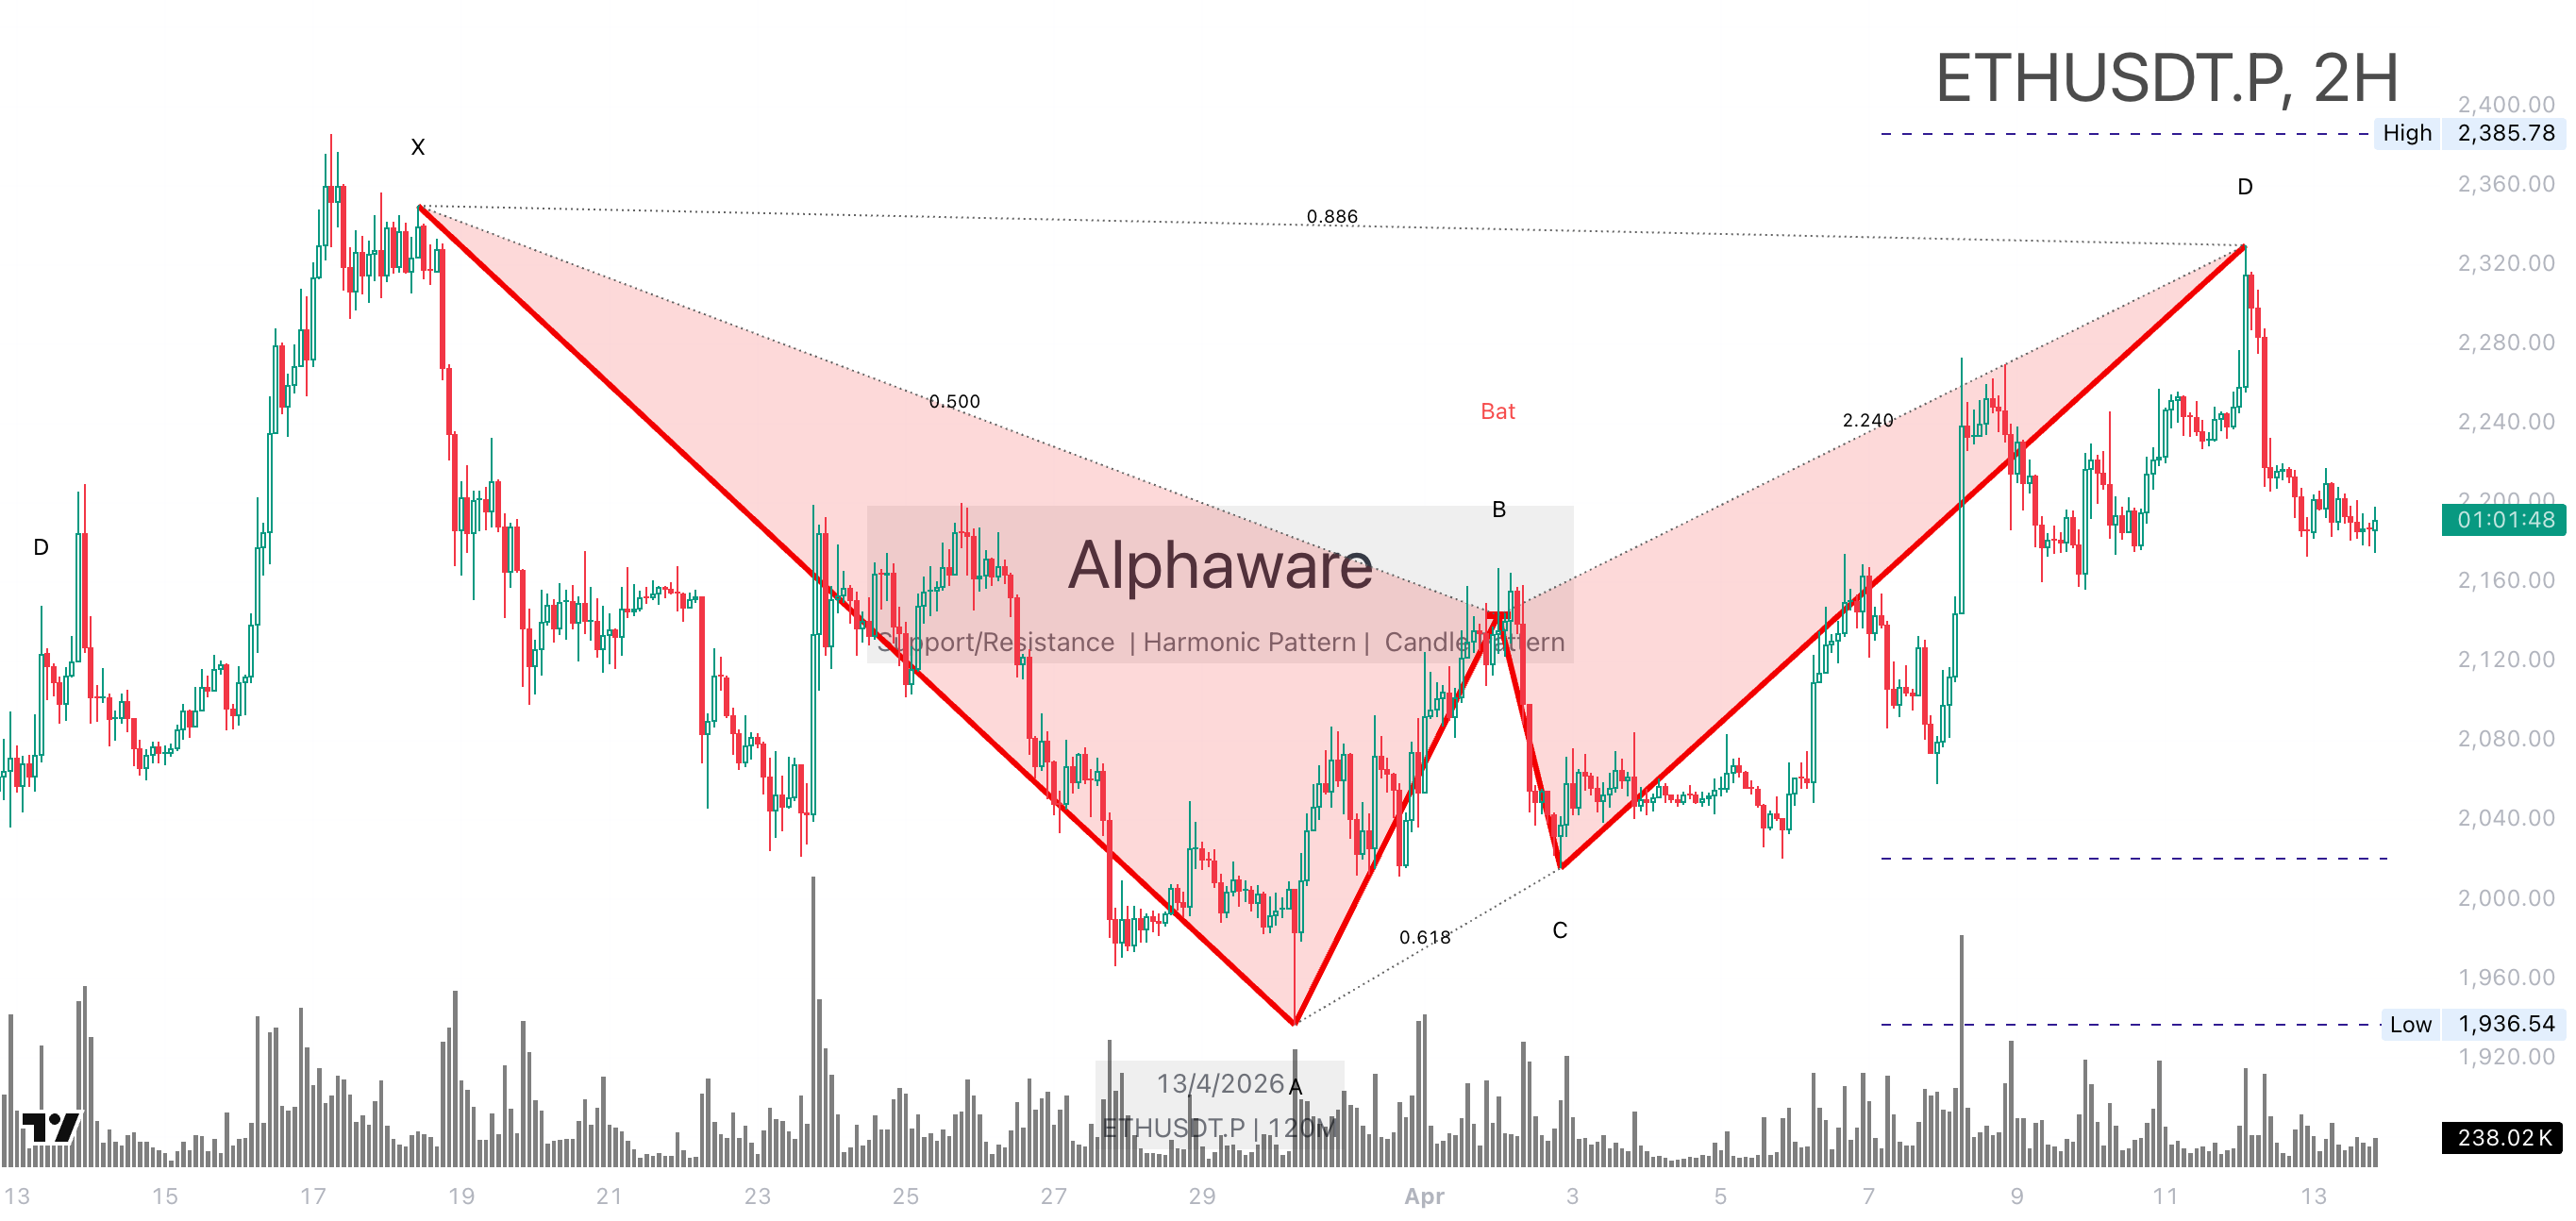 ETH remains more reactive than autonomous here
DXY Alphaware Pattern, Dollar Strength Pressures BTC
DXY (Dollar Index) is trading in a sideways range, with an Alphaware pattern (a harmonic pattern suggesting V-bottom formation) identified, showing bullish reversal signals with a confidence of 0.7. This pattern hints at potential dollar strength.
Key levels include support at 99.000 and resistance at 0.786 and 100.400. DXY strength typically acts as downward pressure on Bitcoin, so the realization of this pattern will be a crucial variable for BTC’s short-term outlook.
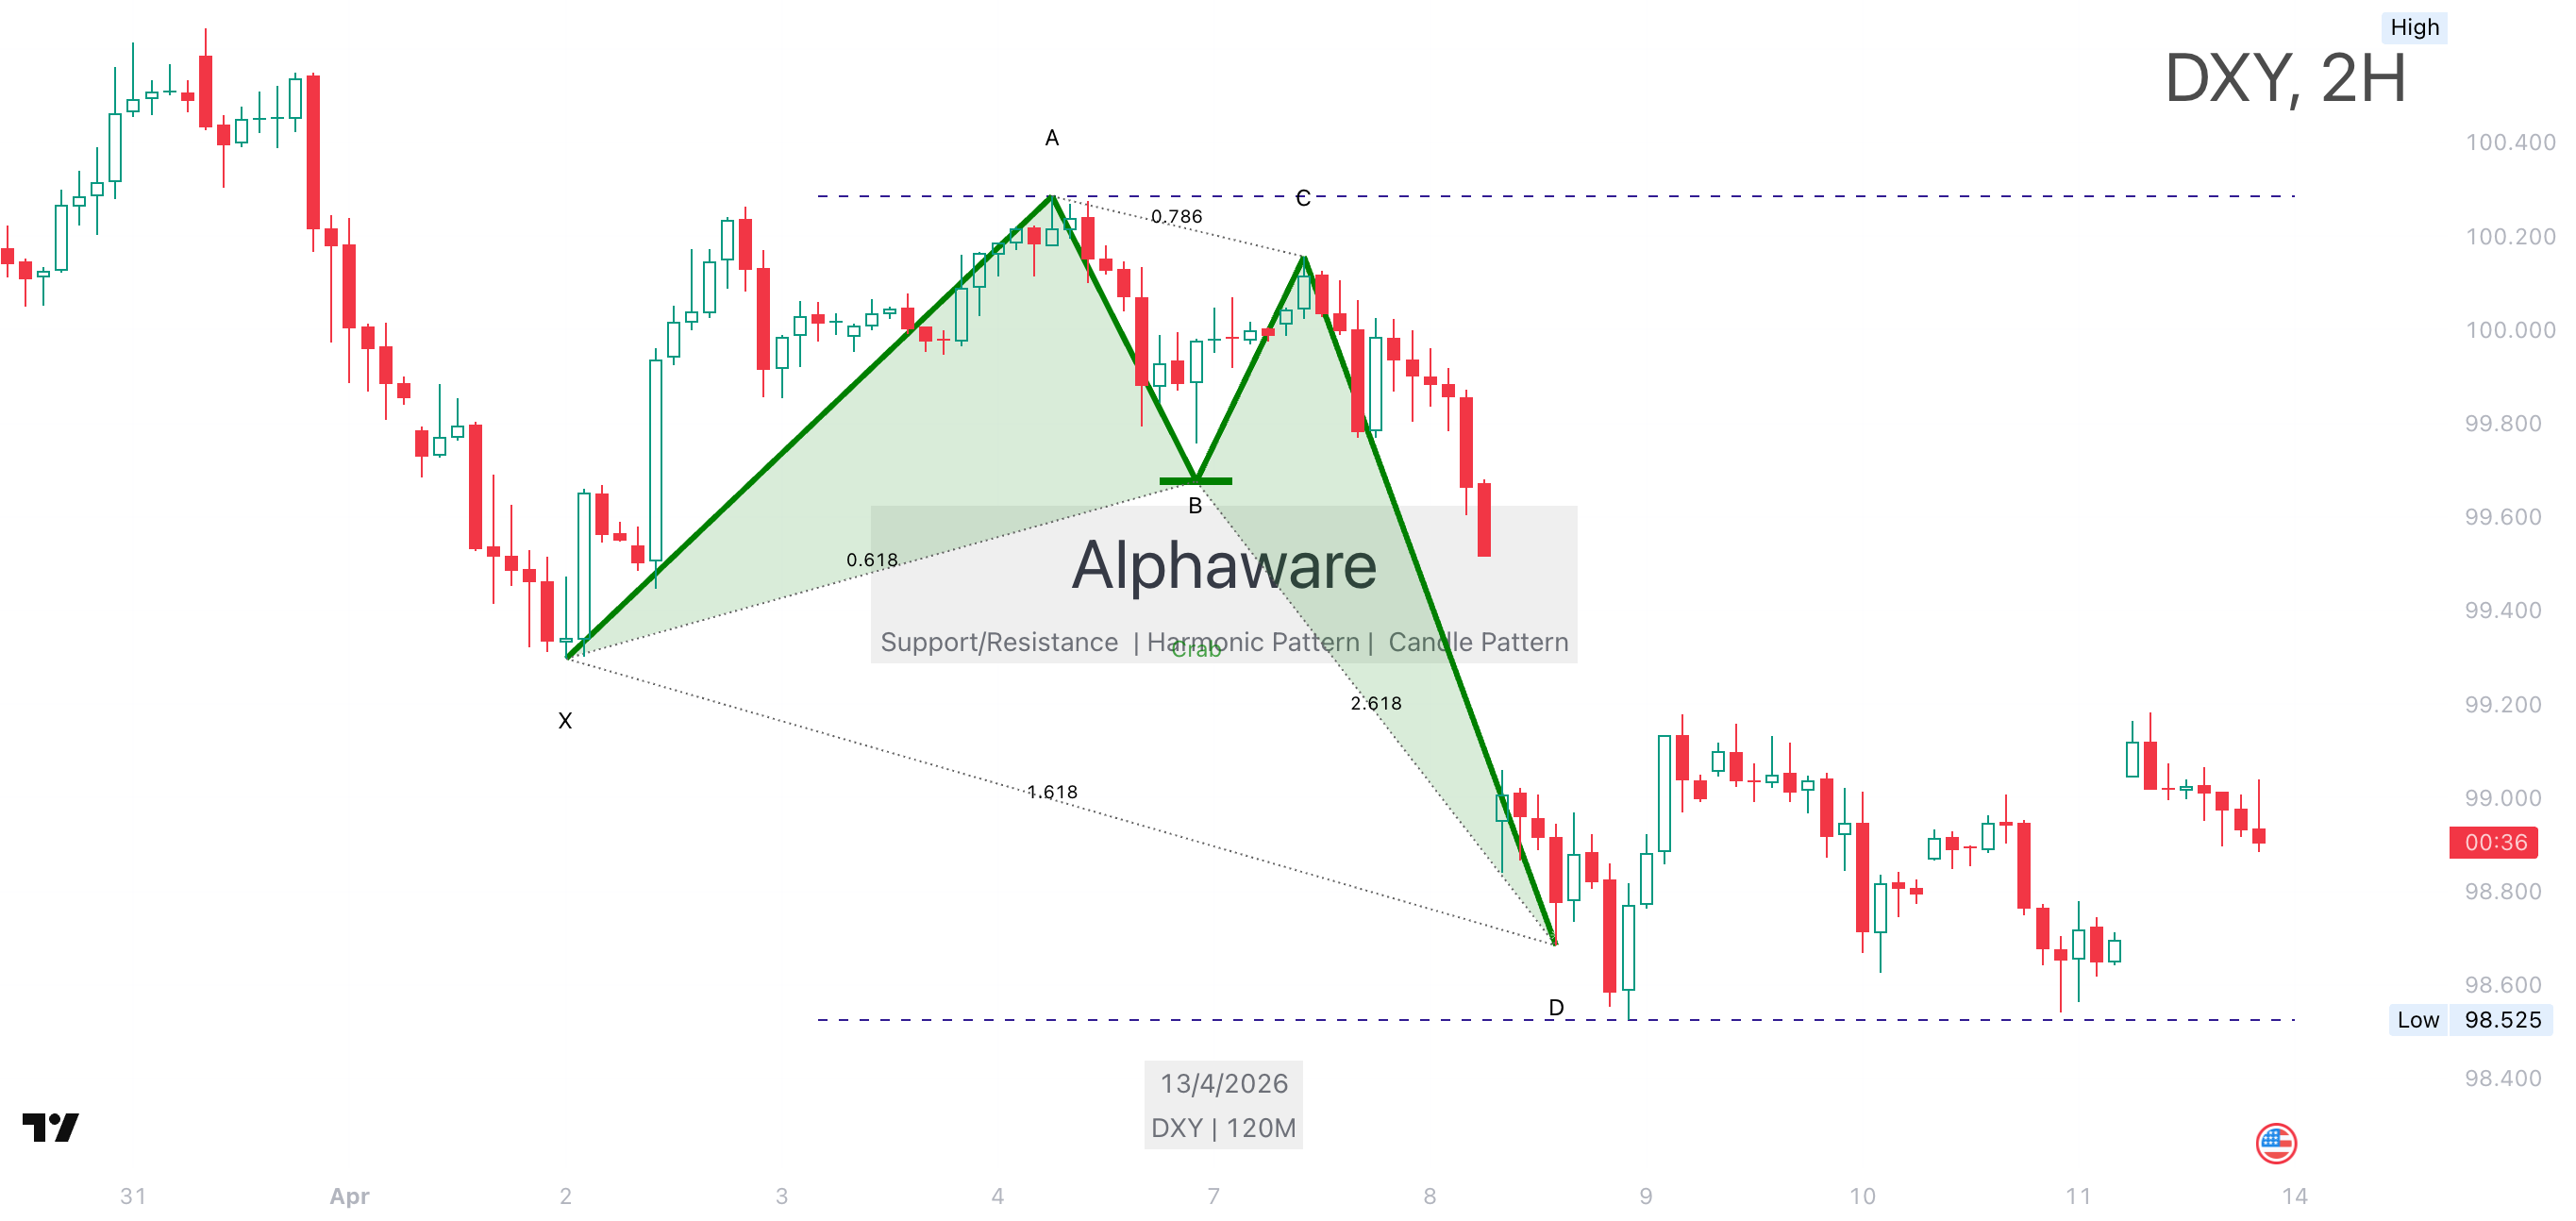 DXY Alphaware pattern suggests dollar strength reversal
Macro and major headlines
Mixed Signals from Macro Sentiment Drop and Fear Gauge
Macro sentiment analysis is negative at -0.077, reflecting global economic uncertainty affecting markets. The Fear and Greed Index is at 12 (Extreme Fear), indicating highly cooled sentiment. Historically, Extreme Fear zones can seek rebound opportunities, but currently clash with DXY strength signals, making direction ambiguous.
High-impact events include Bitmine’s large ETH purchase (71,524 ETH) as positive, but DOT exploit (1B DOT dump) and KPMG’s economic outlook report (‘Running on Empty?’) may have negative impacts. These mixed macro signals could increase market volatility.
SPX (S&P 500) is mentioned as neutral (mixed), expected to have limited impact on global risk asset flows.
| Indicator | Current read | Market implication |
|---|---|---|
| BTC Price | $70,982 (-2.9%), 7-day range $68,800~$73,107 | Defending mid-range, seeking short-term direction |
| DXY Pattern | Alphaware (bullish), confidence 0.7 | Dollar strength signal, potential headwind for BTC |
| Fear and Greed Index | 12 (Extreme Fear) | Cooled sentiment, possible rebound opportunity |
Table summarizes today’s key metrics. Figures are based on real-time data.
Economic calendar and FOMC watch
Economic Calendar Limited, Market Focuses on Technical Signals
No high-impact economic events are confirmed today, so the market may rely more on technical analysis and on-chain data. This means pattern signals from DXY and BTC could drive short-term volatility.
Future schedules will see Fed policy news (event count 106) and regulation (405) as key variables, requiring investor attention.
On days with empty economic calendars, markets react to intrinsic factors, making today’s cross-asset signals (DXY vs BTC) particularly important.
-
The next FOMC meeting is scheduled for 2026-04-28 to 2026-04-29 ET.
-
For Korea time, the main reaction window is likely the early hours of 2026-04-30.
Collected news and high-impact events
News Focuses on AI Race, Supply Chain Shifts, Whale Moves
Collected news shows ‘China is winning the AI talent race’ (The Economist, source: unusual_whales) with positive sentiment (+1.00), potentially indirectly affecting tech stocks. Conversely, ‘65% of Americans oppose building data center’ (Quinnipiac, source: unusual_whales) has neutral sentiment (-0.00), with limited direct market impact.
Whale moves include 272 BTC ($19.2M) transferred from Binance to Unknown (source: WhaleBot Alerts) and 89.8M XRP ($119.8M) from Unknown to Binance (source: WhaleBot Alerts). Such large movements could affect market liquidity, but data is insufficient to determine short-term price direction.
Political figure-related news is omitted due to unclear direct market impact. Overall, news provides mixed signals, with technical analysis potentially more important.
On-chain and derivatives
On-Chain Outflows Supportive, Funding Rates Neutral
On-chain data shows exchange BTC net outflows at -18,057 BTC (7-day), suggesting spot selling pressure has eased as coins leave exchanges. This can be interpreted as a short-term bullish signal. Simultaneously, BTC ETF net inflows at $308 show limited but positive fund flow.
On the derivatives side, funding rates are neutral at BTC -0.0002% and ETH 0.0000%, with the 7-day average funding (BTC -0.0003%) similar. This indicates leveraged traders are not taking extreme positions.
Overall, on-chain shows supportive signals from outflows, while derivatives remain neutral, forming a mixed flow.
Near-term scenarios
Base case
If BTC tests the $70,000 resistance based on the Bat pattern and exchange net outflows, attempting a short-term rebound, it could rise to the $72,000~$76,000 range. However, DXY strength signals may have limited impact, likely maintaining mixed sideways movement.
Alternative case
If the DXY Alphaware pattern strongly realizes and the dollar rises, BTC could face downward pressure toward the $66,000~$65,000 support levels. In this case, fear sentiment could deepen, leading to further decline potential.
Checklist
- Monitor BTC $70,000 resistance breakout
- Watch whether ETH can hold the 2.2K zone while BTC tests resistance
- Watch DXY 99.000 support defense and upward signals
- Track exchange net outflow trends
- Detect sentiment shifts via Fear and Greed Index changes
Related reads
2026년 04월 10일 암호화폐 시장 분석 2026년 04월 08일 암호화폐 시장 분석 2026년 04월 07일 암호화폐 시장 분석
FAQ
What exactly is the Bat pattern?
The Bat pattern is a type of harmonic pattern (a technical analysis tool where prices move in specific ratios) that suggests a bullish reversal after point A. Its confirmation can indicate short-term upside momentum, but cross-verification with other indicators is needed.
Why is DXY strength bad for Bitcoin?
DXY (Dollar Index) strength means a rising dollar value, which can reduce investment appeal for risk assets like Bitcoin, acting as downward pressure. Historically, the dollar and Bitcoin often show an inverse correlation.
Is Fear and Greed Index 12 (Extreme Fear) a buying opportunity?
When the Fear and Greed Index is in the Extreme Fear zone, market sentiment is highly cooled, potentially seeking rebound opportunities. However, this is just an indicator; comprehensive judgment considering headwinds like DXY is necessary.
Related Posts
Newsletter
Weekly Quant & Market Insights
Get market analysis, quant strategy ideas, and AI & data tool insights delivered to your inbox.
Subscribe →