The Complete Guide to Bollinger Bands: How to Read Volatility for Beginner Investors
A simple explanation of Bollinger Bands, from the basics to practical application. Learn how to make smarter trading decisions by measuring volatility, identifying overbought/oversold zones, and combining strategies with other indicators.
볼린저밴드 사용법 대표 이미지
Bollinger Bands are a powerful technical analysis tool consisting of three lines plotted on a chart, showing the ‘moving channel’ of a stock price. By reading this article, you will easily understand what Bollinger Bands signify and learn how to move beyond simply looking at lines to read market volatility and potential reversal signals. It is especially designed to be beginner-friendly, guiding you with helpful analogies and step-by-step explanations for immediate practical application.
Understanding the Core Concept: The ‘Stock Price Moving Channel’
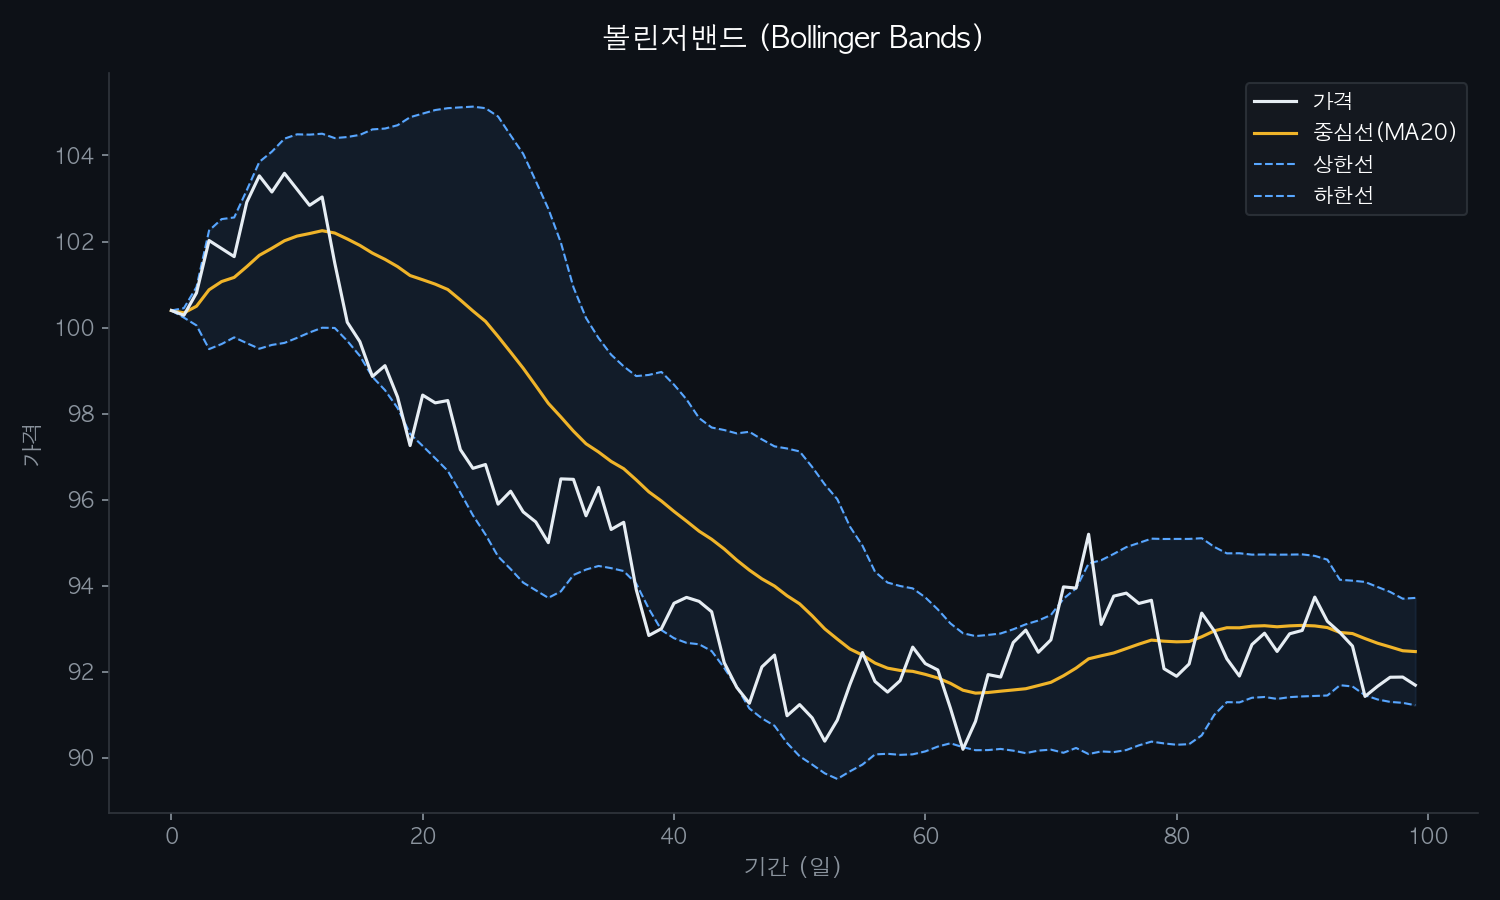
Bollinger Bands is an indicator created by John Bollinger, primarily composed of three lines.
- Middle Band: Typically uses a 20-day moving average. It acts as the ‘baseline,’ representing the average stock price over the last 20 days.
- Upper Band: Created by adding twice the value of a statistical concept called ‘standard deviation’ to the middle band. It shows the upper range where the stock price can reach with a certain probability.
- Lower Band: Created by subtracting twice the standard deviation from the middle band. It shows the lower range where the stock price can decline with a certain probability.
Standard deviation is a numerical value indicating how spread out data is from the average. Here, it serves as a measure of ‘stock price volatility (the magnitude of movement).’ Higher volatility widens the gap between the upper and lower bands (bandwidth), while lower volatility narrows the bandwidth.
Real-life Analogy: A Dog and a Leash Think of the middle band as the owner (the average stock price) and the upper and lower bands as the length of the leash within which the dog (the current stock price) can move. If the dog runs around actively (high volatility), the leash becomes taut and the range widens. Conversely, if it walks calmly (low volatility), the leash loosens and the range narrows. When the dog reaches the end of the leash (upper/lower band), it may momentarily change direction (reversal) or the leash may stretch further (trend continuation). Bollinger Bands are precisely the tool that shows this ‘range and pattern of the dog’s movement.’
 볼린저밴드 사용법 개념 이미지
3 Practical Application Methods
Bollinger Bands should be used not in isolation but as a ‘lens’ to read the situation. The main points of application are as follows.
1. Reading Volatility and Trends
- Bandwidth Expansion: When the upper and lower bands start to widen, it indicates increasing volatility and a higher likelihood of a new trend starting. You should prepare for significant price movements at this time.
- Bandwidth Contraction: When the upper and lower bands narrow, it means volatility is decreasing and the stock price is moving sideways. This ‘quiet period’ is often followed by strong upward or downward movements accompanied by volatility expansion, so it should be observed carefully.
2. Identifying Overbought/Oversold Zones (Short-term Reversal Signals)
Statistically, stock prices move within the bands about 95% of the time. Therefore, a stock price breaking outside the band is considered a special situation.
- When the price breaks above the upper band: It is highly likely to be in a short-term ‘overbought’ state. This is a condition where buying pressure has been exerted to its fullest, so the price may soon decline (correct) as that force weakens. This is not an automatic buy signal.
- When the price breaks below the lower band: It is highly likely to be in a short-term ‘oversold’ state. This is a condition where selling pressure has been exerted to its fullest, so a rebound may occur. Similarly, this is not an automatic sell signal.
3. Confirming Signals by Combining with Other Indicators (Essential!)
Trading based solely on Bollinger Bands is risky. To increase the reliability of signals, confirm them with other indicators.
- Combining with RSI (Relative Strength Index): If the stock price touches the upper band while the RSI is also above 70 (overbought), the possibility of a correction becomes even higher. Conversely, if the stock price touches the lower band while the RSI is also below 30 (oversold), the possibility of a rebound becomes even higher.
- Combining with Trend Indicators (like MACD): If a touch of the upper/lower band occurs during an existing strong uptrend/downtrend, it may be just a simple correction and the trend could continue. If the MACD (Moving Average Convergence Divergence) shows a strong bullish signal, the upper band touch might be a temporary phenomenon.
Reference: Bollinger Bands Calculation Pseudocode (Example for understanding)
Middle Band = 20-day Moving Average (MA20)
Standard Deviation = Standard deviation of stock prices over the last 20 days
Upper Band = Middle Band + (Standard Deviation * 2)
Lower Band = Middle Band - (Standard Deviation * 2)
In practice, this can be easily applied in TradingView, Kiwoom Securities API, etc.
 볼린저밴드 사용법 개념 차트
Precautions and Risks
Bollinger Bands are not a universal tool. You must keep the following points in mind when using them.
- Lagging Indicator: They are created based on past and present data, so they cannot 100% predict the future.
- False Signals Occur: In strong trending markets, the stock price can continue to rise along the upper band (‘band walk’) or fall along the lower band. Misinterpreting a band touch as a reversal signal at this time can lead to significant losses.
- Dependence on Volatility: In periods of very low volatility (narrow bands), the meaning of signals can weaken.
- Composite Analysis is Essential: As emphasized earlier, you should never make trading decisions based on Bollinger Bands alone. You must confirm signals with at least one other indicator, such as RSI, trading volume, or trend lines.
Investing always carries the risk of principal loss. There is no guarantee that past patterns will repeat in the future. This article is for educational and informational purposes only, not investment advice. The final investment decision and responsibility for it lie with the individual.
 볼린저밴드 사용법
FAQ
Q: Is it better to change the Bollinger Bands settings (20-day, 2x standard deviation)? A: The default settings (20,2) are the most commonly validated. Short-term traders sometimes reduce the period to 10 days for more sensitivity, while long-term investors may increase it to 50 days for more stability. However, we recommend getting familiar with the defaults first and then adjusting them to suit your trading style.
Q: Under what market conditions do Bollinger Bands work best? A: They are relatively useful for catching reversal signals in ‘ranging markets’ without clear trends or in markets with moderate volatility. However, extra caution is needed in interpreting signals during strong trending markets like bull or bear markets.
Q: What does it mean when the stock price breaks above or below the middle band? A: When the stock price moves above the middle band (20-day moving average), it can be interpreted as a reference point indicating a short-term bullish phase; moving below indicates a bearish phase. In particular, the middle band itself can sometimes act as a support or resistance line.
Related Posts

Newsletter
Weekly Quant & Market Insights
Get market analysis, quant strategy ideas, and AI & data tool insights delivered to your inbox.
Subscribe →