How to Read Candlestick Charts: The Complete Guide for Beginners
This guide is for those new to candlestick charts. Covering the meaning of bullish and bearish candles, common patterns, and the basics of chart reading.
What is a Candlestick Chart
A candlestick chart represents price movements over a set period with individual “candles.” It is used for analyzing almost all financial assets such as stocks, cryptocurrencies, and forex.
Each candlestick contains four key pieces of information:
- Open: The price at the start of the period
- Close: The price at the end of the period
- High: The highest price during the period
- Low: The lowest price during the period
These four data points are compressed into a single visual candle.
Bullish and Bearish Candles
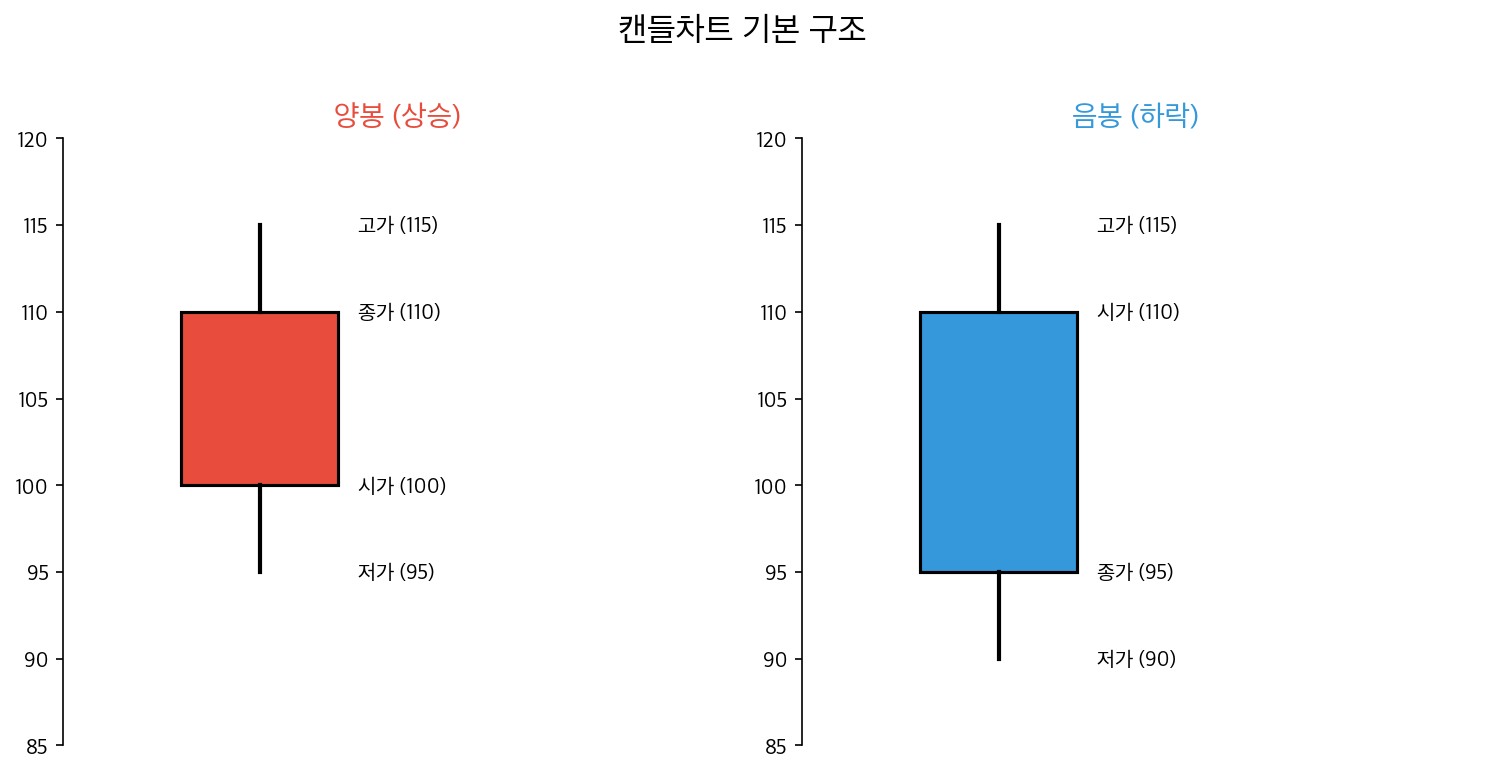
Bullish Candle (Rise Candle)
When the close is higher than the open, it’s a bullish candle. Usually displayed in green or red. It indicates prices rose during the period.
The thicker the body (the part between open and close), the greater the price increase.
Bearish Candle (Fall Candle)
When the close is lower than the open, it’s a bearish candle. Usually shown in red or blue. It indicates a price drop.
Tails (Wicks)
Thin lines protruding above and below the candle are called tails or wicks.
Long upper wick: Price temporarily spiked up but then fell back. Indicates selling pressure.
Long lower wick: Price dropped sharply but recovered. Suggests buying support.
What Candles Mean Over Different Timeframes
The same chart can have different implications depending on the timeframe.
| Timeframe | Candlestick Duration | Typical Users |
|---|---|---|
| 1-minute | 1 minute | Scalpers (ultra-short term) |
| 15-minute | 15 minutes | Day traders |
| 1-hour | 1 hour | Short-term traders |
| 4-hour | 4 hours | Swing traders |
| Daily | 1 day | Mid-term investors |
| Weekly | 1 week | Long-term investors |
Initially, it’s recommended to look at daily charts for overall trends and then zoom into 4-hour charts for details.
5 Essential Candle Patterns to Know
1. Doji
A candle where the open and close are nearly identical. The body is very thin or absent, with only upper and lower wicks.
Meaning: Indicates indecision between buyers and sellers. Can signal a trend reversal. When a doji appears at the end of an uptrend, it suggests possible reversal to the downside.
2. Hammer
A candle with a long lower wick at least twice the size of the body, with little or no upper wick.
Meaning: Signals potential reversal at the end of a downtrend. Shows that sellers pushed prices down sharply, but buyers regained control.
3. Hanging Man
Looks like a hammer but appears at the end of an uptrend.
Meaning: Warning sign that selling pressure is increasing, potentially foreshadowing a trend reversal downward.
4. Engulfing
A large candle that completely engulfs the previous candle’s body.
Bullish Engulfing: A bigger bullish candle following a smaller bearish candle → buyers are gaining control, potential upward reversal Bearish Engulfing: A bigger bearish candle after a bullish candle → sellers gain control, potential downward trend
5. Long-Legged Doji
A doji with very long upper and lower wicks.
Meaning: The market experienced significant volatility but ultimately returned to the starting point. Indicates high uncertainty.
Why You Shouldn’t Rely Only on Candles
Making trading decisions based solely on individual candles can be risky. Candle patterns indicate probabilities, not certainties.
Things to consider alongside candles:
- Volume: Confirm patterns with volume; high volume adds reliability.
- Support and Resistance: Patterns emerging at key price levels are more meaningful.
- Auxiliary Indicators: Combine with RSI, MACD, etc., for better accuracy.
- Trend: Candle significance varies depending on whether they appear within an uptrend or downtrend.
Recommended Steps When Starting
- Develop the ability to distinguish bullish and bearish candles.
- Begin with Doji and Hammer patterns (most common and intuitive).
- Practice on daily charts (less noise).
- Use free chart tools like TradingView.
- Observe extensively before trading actively.
Chart analysis is a skill developed over time. Spend at least a month daily reviewing charts and recognizing patterns.
Related Articles
Bitcoin consolidates at 69K amid DXY decline, check for bullish signals
Bitcoin breaks 72K with Middle Eastern ceasefire and stablecoin news, confirming upward momentum
Fear Index drops to 11, three conditions for BTC rebound in extreme fear
Related Posts
Newsletter
Weekly Quant & Market Insights
Get market analysis, quant strategy ideas, and AI & data tool insights delivered to your inbox.
Subscribe →