How to Read MACD: Spot Golden Crosses and Timing Trades
This guide covers the components of the MACD indicator, how to interpret it, and how to utilize Golden Cross / Dead Cross signals. It is one of the most widely used trend-following indicators.

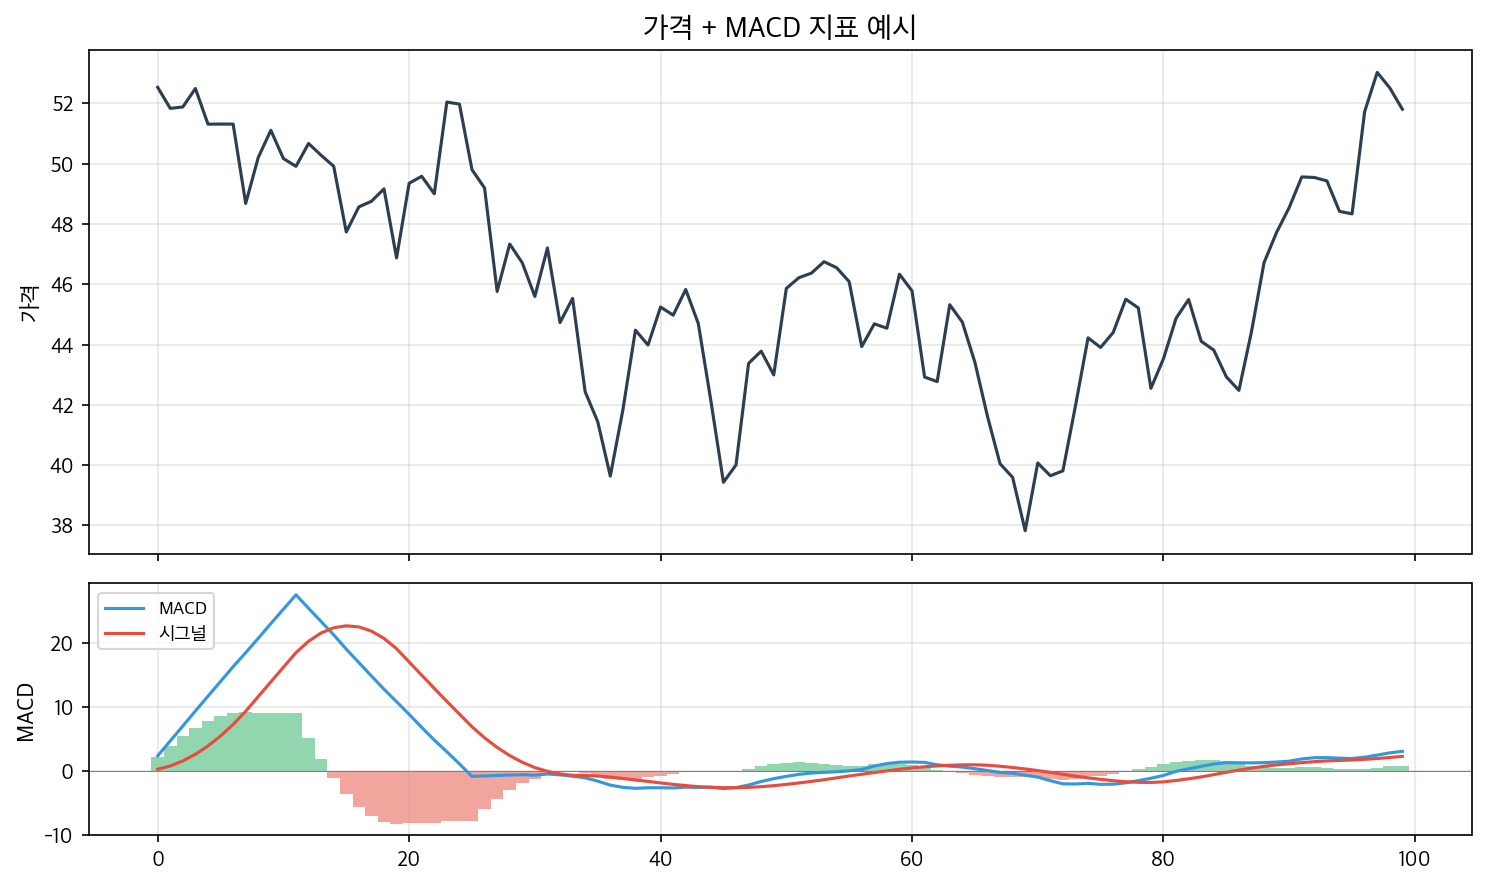
What is MACD?

MACD (Moving Average Convergence Divergence) is an indicator that shows how much two moving averages are diverging or converging. The name is lengthy, but the concept is simple.
It calculates the difference between a fast moving average (12 days) and a slow moving average (26 days). When the lines diverge, it indicates a strong trend; when they converge, the trend weakens.
The Three Components
MACD Line (Fast Line)
The difference between the 12-day EMA (Exponential Moving Average) and the 26-day EMA. A positive value means the short-term average is above the long-term, and a negative value means below.
Signal Line (Slow Line)
The 9-day EMA of the MACD line. An additional smoothing of the MACD line; it moves more slowly.
Histogram (Bar Graph)
Displays the difference between the MACD line and the Signal line using bars. Positive bars indicate MACD is above the Signal line; negative bars indicate below. Growing bars suggest strengthening trends, while shrinking bars suggest weakening trends.
Basic Interpretation
Golden Cross (Buy Signal)
When the MACD line crosses above the Signal line from below, it’s a golden cross. This indicates that the short-term trend is gaining strength over the long-term, signaling a potential uptrend.
It coincides with the histogram turning from negative to positive.
Dead Cross (Sell Signal)
When the MACD line crosses below the Signal line from above, it’s a dead cross, signaling a potential downtrend as buying momentum weakens.
Zero Line Break
When the MACD line crosses above zero, it suggests the short-term moving average is above the long-term, confirming an uptrend. Crossing below zero indicates a downtrend.
Practical Usage Tips
1. Golden Cross + Above Zero Line = Strong Buy Signal
If a golden cross occurs below the zero line, it might just be a rebound within a downtrend. But when the golden cross happens above zero, it confirms an established uptrend and signals a stronger buy. This combination is more reliable.
2. Divergence (Trend Reversal Detection)
Like RSI, MACD divergence is a powerful signal.
Bullish Divergence: Price makes lower lows, but MACD forms higher lows → Indicates weakening downward momentum and potential reversal upwards.
Bearish Divergence: Price hits higher highs, but MACD makes lower highs → Signal weakening upward momentum and potential reversal downward.
3. Using the Histogram to Gauge Trend Strength
A growing histogram indicates strengthening current trend; a shrinking histogram suggests weakening.
Observe the histogram early: if it starts shrinking before a crossover, it may signal an impending trend reversal.
Limitations of MACD
Lagging Indicator
Since MACD is based on moving averages, it is a lagging indicator that signals after the move has begun. By the time a golden cross appears, much of the upward move might already have happened. So, entries can be late.
False Signals in Sideways Markets
In range-bound or sideways markets, MACD can produce frequent false signals due to recurrent crossovers. In such conditions, indicators like RSI or Bollinger Bands may be more effective.
Default Settings Not Always Optimal
The common settings (12, 26, 9) date back to the 1970s. For highly volatile assets like cryptocurrencies, faster settings (e.g., 6, 13, 5) might work better, while slower settings suit long-term investing.
Differences Between RSI and MACD
| Aspect | RSI | MACD |
|---|---|---|
| Type | Momentum | Trend Following |
| Main Use | Overbought/Oversold | Trend Direction & Strength |
| Sideways Market | Useful | Prone to False Signals |
| Trending Markets | Warning of Overheating | Very Useful |
| Lagging | Little | Significant |
Using both together is ideal. Check RSI for overbought/oversold conditions and MACD for trend confirmation to improve accuracy.
Summary
MACD is a trend-following indicator. Its basic signals include Golden Cross and Dead Cross, with divergence providing the strongest clues. Using the histogram can help anticipate trend changes before crossovers occur.
However, be cautious in sideways markets, where false signals abound. Combining MACD with other indicators like RSI enhances reliability.
Related Articles
Bitcoin 69K Consolidation Continues, Gauging Long-term Strength Amid DXY Downtrend
Bitcoin Breaks 72K, Boosted by Middle East Ceasefire and Stablecoin Rally
Fear Index at 11: Conditions for Bitcoin Rebound in Extreme Fear }
Related Posts


Newsletter
Weekly Quant & Market Insights
Get market analysis, quant strategy ideas, and AI & data tool insights delivered to your inbox.
Subscribe →