Complete Guide to the RSI Indicator: Identifying Overbought and Oversold Conditions
Learn what RSI is, how to interpret it, and how to use it in practice. Remember, RSI above 70 doesn't always mean it's time to sell.

What is RSI?

RSI (Relative Strength Index) is an indicator that shows how quickly prices have risen or fallen as a number between 0 and 100. Developed by Wells Wilder in 1978, it remains one of the most widely used secondary indicators.
The core idea is simple. If recent days have more upward moves, RSI increases; if more downward moves, RSI decreases.
Basic How-To
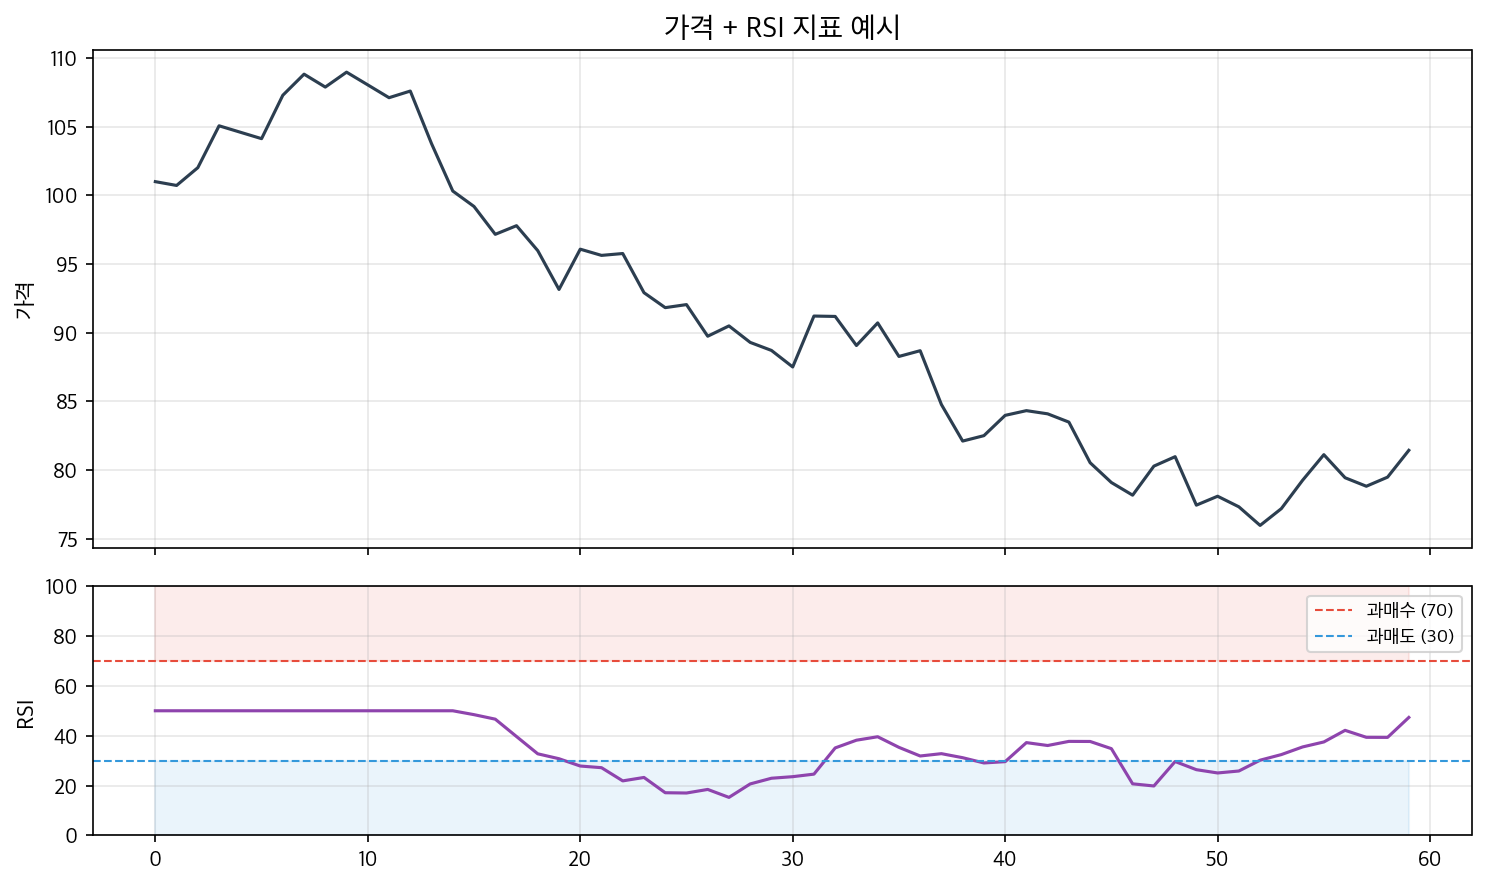
| RSI Range | Meaning | Typical Interpretation |
|---|---|---|
| 70 or above | Overbought | Price might be overextended, potential for pullback |
| 30–70 | Neutral | Normal range |
| 30 or below | Oversold | Price might be oversold, potential rebound |
Note: “Selling just because RSI is above 70” is not a rule. During strong uptrends, RSI can stay above 70 for extended periods. Do not base trading decisions solely on RSI.
How RSI is Calculated
The default setting is 14 days. It compares the average gains and losses over the past 14 days.
RS = Average Gain over 14 days / Average Loss over 14 days
RSI = 100 - (100 / (1 + RS))
If there are significantly more up days, RSI approaches 100; if more down days, it approaches 0.
Shorter periods (e.g., 7 days) react more quickly, while longer periods (e.g., 21 days) are slower but more stable. Start with the default 14 days.
Three Practical Uses
1. Overbought/Oversold Reversals
The most basic application.
- When RSI dips below 30 and then rises again → consider buying
- When RSI rises above 70 and then declines → consider selling
Key point: “When RSI reaches 30” is less important than “when RSI bounces back after falling below 30.” Buying during a decline might lead to further drops.
2. Divergence (Most Powerful Signal)
Price hits a new low but RSI forms a higher low → suggests weakening downward momentum, potential for rebound. This is called Bullish Divergence.
Conversely, price hits a new high but RSI forms a lower high → indicates weakening upward momentum, potential for decline. This is Bearish Divergence.
Divergences are among the most reliable early warnings of trend reversals.
3. Trend Judgment Based on 50 Line
If RSI is above 50 → uptrend; below 50 → downtrend.
This method provides a broader view compared to overbought/oversold signals. If the daily RSI stays above 50, the uptrend remains active.
Common Mistakes
”Always sell when RSI hits 70”
During strong rallies, RSI can stay above 70 for weeks or months. For example, during Bitcoin bull runs, selling at RSI 80 often results in missing further gains of 2x or more. RSI above 70 indicates “overheated” conditions, not necessarily “sell now.”
Trading based only on RSI
RSI is a secondary indicator. Combine it with candlestick patterns, volume, support/resistance, and other indicators for better accuracy. Relying solely on RSI reduces effectiveness.
Not adjusting the period setting
The default 14 days isn’t always optimal. For short-term trading, 7–9 days may be better; for long-term investing, 21–25 days could suit. Experiment according to asset and timeframe.
Combining RSI with Other Indicators
Increase RSI accuracy by confirming with other tools:
RSI + Moving Averages: When RSI bounces from oversold levels AND the price breaks above the 20-day moving average → strong buy signal
RSI + MACD: Bullish divergence in RSI combined with MACD gold cross → very strong rebound indicator
RSI + Volume: During oversold RSI, a surge in volume could suggest institutional buying.
Using RSI Across Timeframes
| Timeframe | Usage | Suitable Traders |
|---|---|---|
| 1-hour | Short-term entry/exit timing | Day traders |
| 4-hour | Swing trading signals | Swing traders |
| Daily | Medium-term trend analysis | General investors |
| Weekly | Long-term overbought/oversold | Long-term investors |
Initially, it’s recommended to analyze the overall trend with daily RSI and then fine-tune timing with 4-hour RSI.
Summary
RSI is simple but powerful when used correctly. The key points are:
- 70/30 zones are caution, not sell signals.
- Divergence is the most reliable RSI indicator.
- Always confirm with other indicators.
Related Articles
Bitcoin holding at 69K amid DXY decline, assessing bullish signals
Bitcoin breaks 72K amid Middle East ceasefire and stablecoin hype
VIX at 11, three conditions for Bitcoin rebound in extreme fear
Related Posts

Newsletter
Weekly Quant & Market Insights
Get market analysis, quant strategy ideas, and AI & data tool insights delivered to your inbox.
Subscribe →