Bitcoin Holds 69K Range as DXY Reversal Signals Pull Both Ways
BTC stayed stuck near 69.2K while a dollar rebound signal pressured risk assets. On April 6, exchange outflows and fear sentiment created a split tape rather than a clean directional move.
Why this matters today
BTC 4h chart shows sideways trend with no clear direction
DXY bullish reversal pattern suggests dollar strength, downward pressure on BTC
Exchange outflows and ETF outflows create mixed market signals
Bitcoin: reading the main chart
BTC Consolidates at 69K, Awaiting Direction in 67K~77K Range
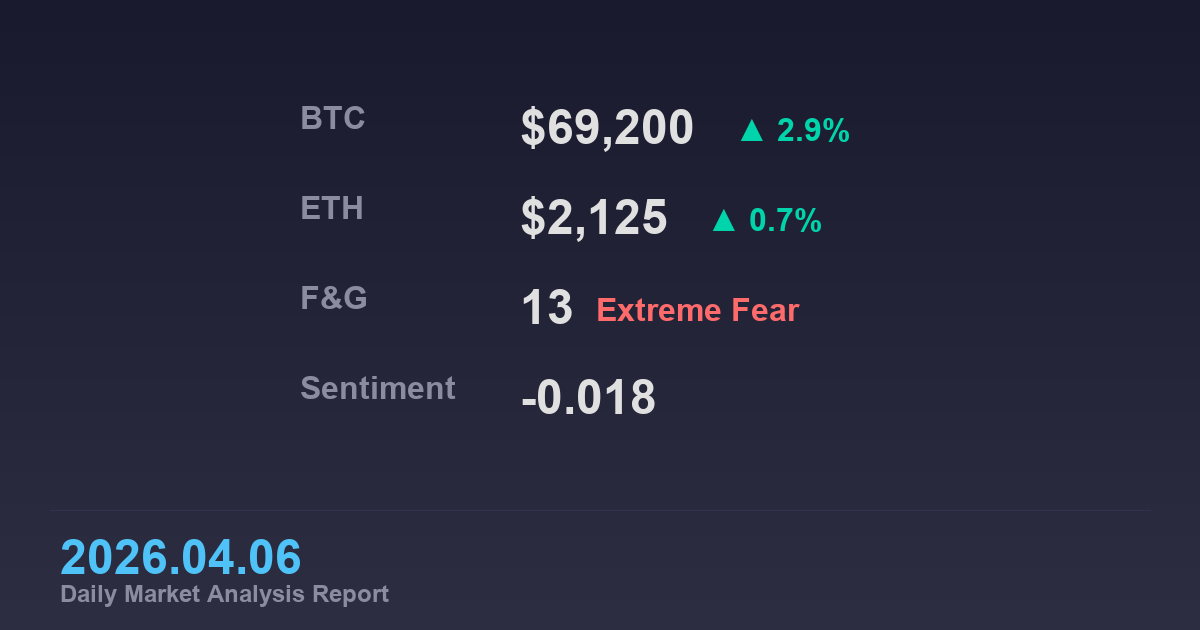
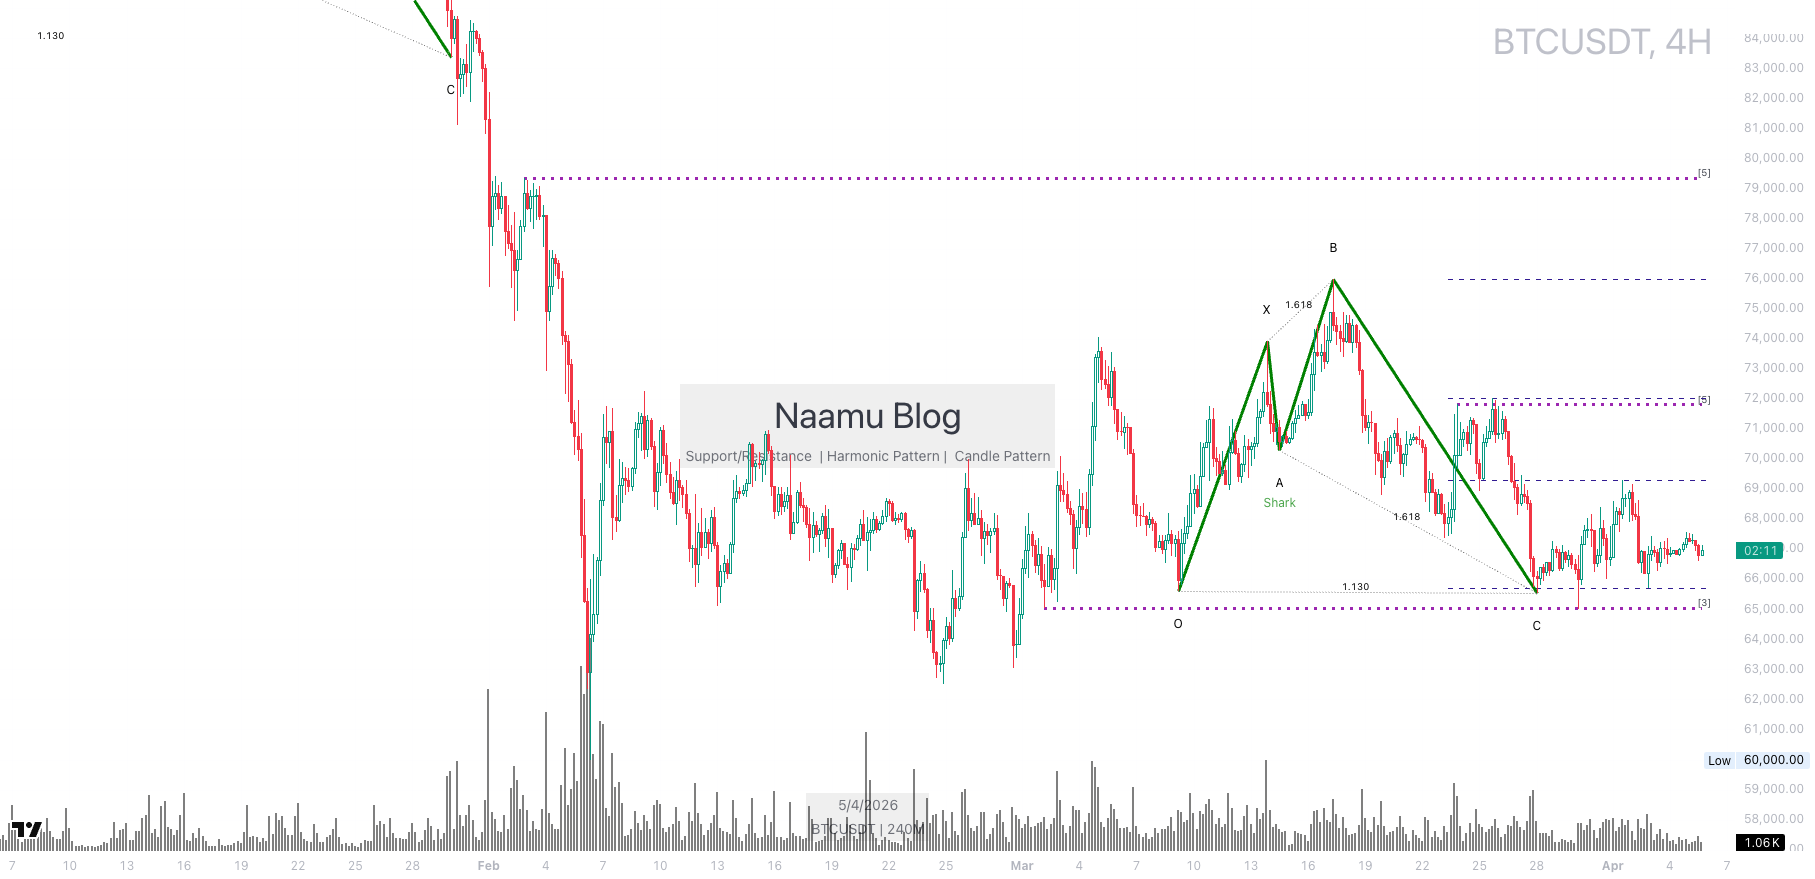
BTC is currently around $69,200, consolidating sideways on the 4-hour chart between support at $67,000 and resistance at $77,000. This aligns with its recent 7-day range ($66,545 – $69,588), showing the market lacks a clear trend.
Technically, $67,000 and $69,000 act as key support levels, with $77,000 as resistance. Chart analysis suggests a Shark harmonic pattern indicates a bullish reversal signal, but without a confirmed break above $77,000, it’s difficult to conclude bullish solely based on this.
A break below the historical $60,000 support could be a decisive trend shift, but the current price is well above that level. Thus, BTC is likely to continue consolidating in the short term, awaiting further catalysts.
 BTC consolidating in $67,000~$77,000 range, awaiting direction. Shark pattern suggests bullish reversal but resistance break unconfirmed.
Cross-asset confirmation
DXY Bullish Reversal Pattern Acts as Downward Pressure on BTC
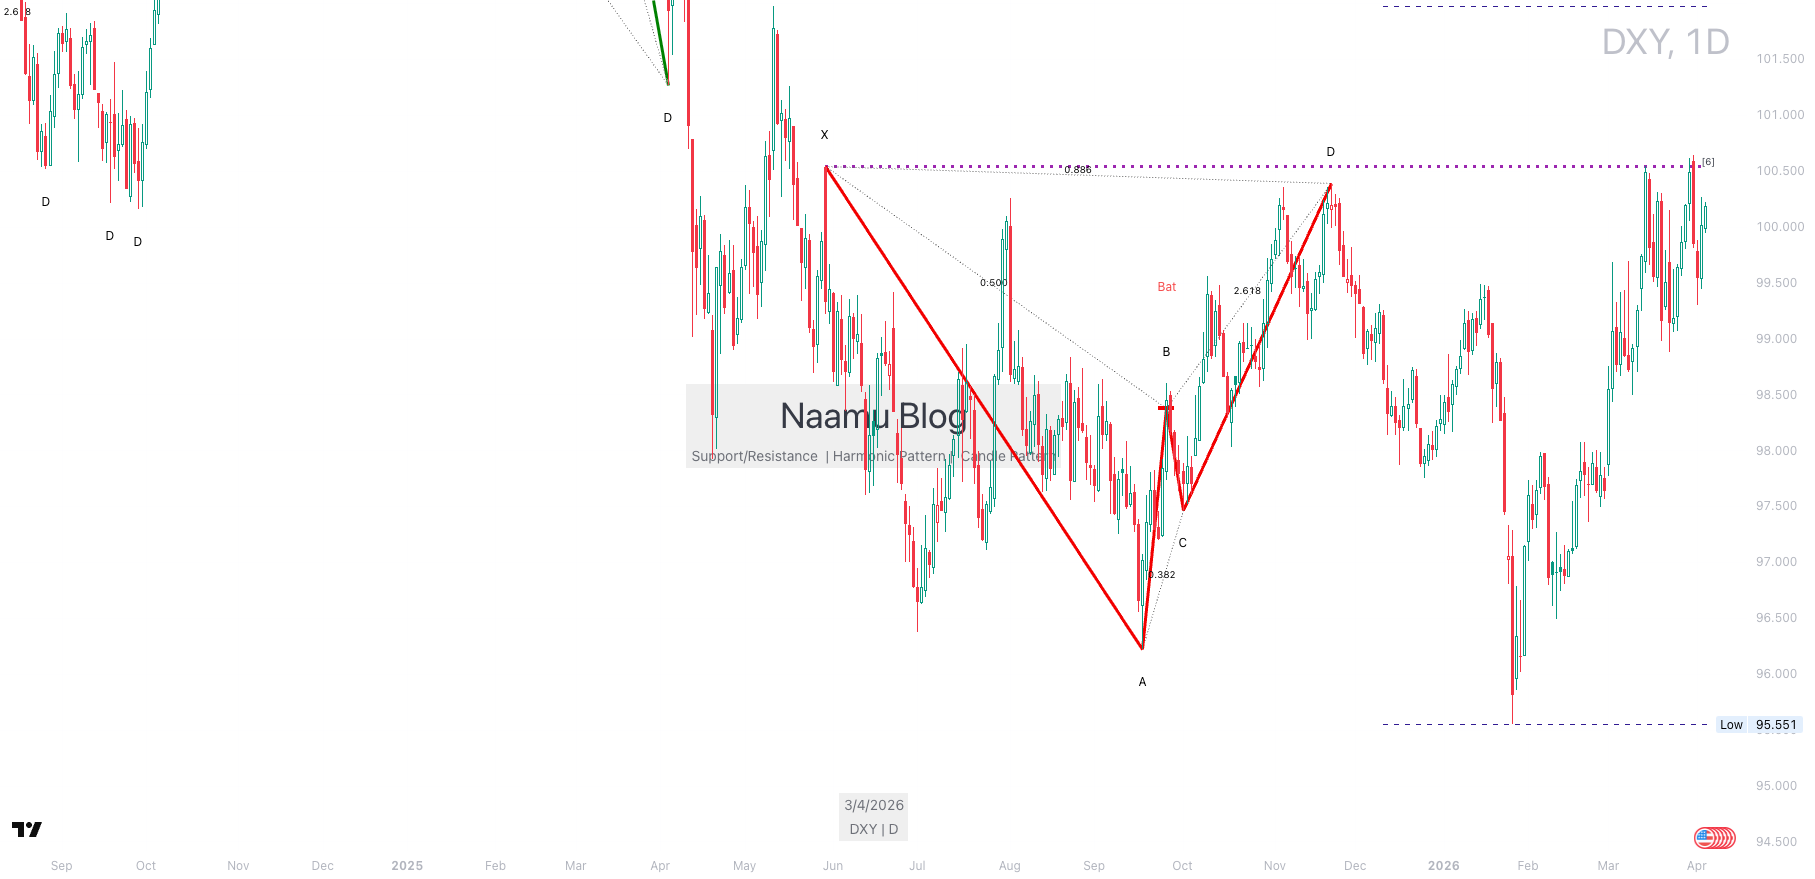
The DXY (Dollar Index) 1-day chart is in a sideways trend, but an XABCD harmonic pattern has formed, interpreted as a strong bullish reversal signal. Key resistance is at 101.500 and 99.500, with support at 97.000 and 95.551.
DXY strength typically acts as a headwind for BTC. As the pattern suggests a bullish reversal, a rise in the dollar’s value could exert downward pressure on BTC prices. This adds further uncertainty to BTC’s consolidation phase.
 DXY forms XABCD harmonic pattern indicating bullish reversal signal. Dollar strength could be headwind for BTC.
Macro and major headlines
Geopolitical News and Rate Movements as Market Variables
Key news includes [tg:Ash Crypto] reporting “US and Iran discussing a 45-day ceasefire deal,” which could have a bullish impact (+1.00 sentiment). Conversely, [tg:Hananya Naftali - Israel News] news of “Head of Revolutionary Guards Intelligence Organization taken out” may have bearish effects (-1.00 sentiment).
Among high-impact events, [scale 8, bullish, regulatory] “US Department of Labor proposes rule to open $10 trillion 401k plans to crypto” is a long-term positive, but short-term market volatility may be limited. [Scale 7, bearish, macro_geopolitical] events reflect geopolitical tensions.
Overall sentiment analysis is -0.018, neutral, but macro sentiment at -0.148 is negative. Momentum at +0.0207 suggests weak upward pressure, yet the Fear & Greed Index at 13 (Extreme Fear) indicates bearish market sentiment.
| Indicator | Current read | Market implication |
|---|---|---|
| BTC Price | $69,200 (+2.9%), 7-day range $66,545~$69,588 | Sideways trend, direction uncertain |
| DXY Pattern | XABCD harmonic pattern formed, bullish reversal signal | Dollar strength potential downward pressure on BTC |
| Exchange Net Outflow | 7-day -18,057 BTC | Signals reduced spot selling pressure |
Table summarizes key indicators for today. Figures are based on real-time data.
On-chain and derivatives
Net Outflows Positive but ETF Outflows and Funding Rates Mixed
On-chain data shows exchange BTC net outflow of -18,057 BTC over 7 days, suggesting easing spot selling pressure. However, BTC ETF net inflow is $-214 over 7 days, indicating outflows that may pose short-term funding pressure.
On the derivatives side, BTC funding rate at 0.0071% is positive but higher than the 7-day average of 0.0007%, possibly signaling short-term overheating. ETH funding rate at 0.0000% is neutral. The USDTD 4h USDCD chart serves as auxiliary data for monitoring stablecoin liquidity.
On the derivatives side, BTC funding rate at 0.0071% is positive but higher than the 7-day average of 0.0007%, possibly signaling short-term overheating. ETH funding rate at 0.0000% is neutral. The USDTD 4h USDCD chart serves as auxiliary data for monitoring stablecoin liquidity.
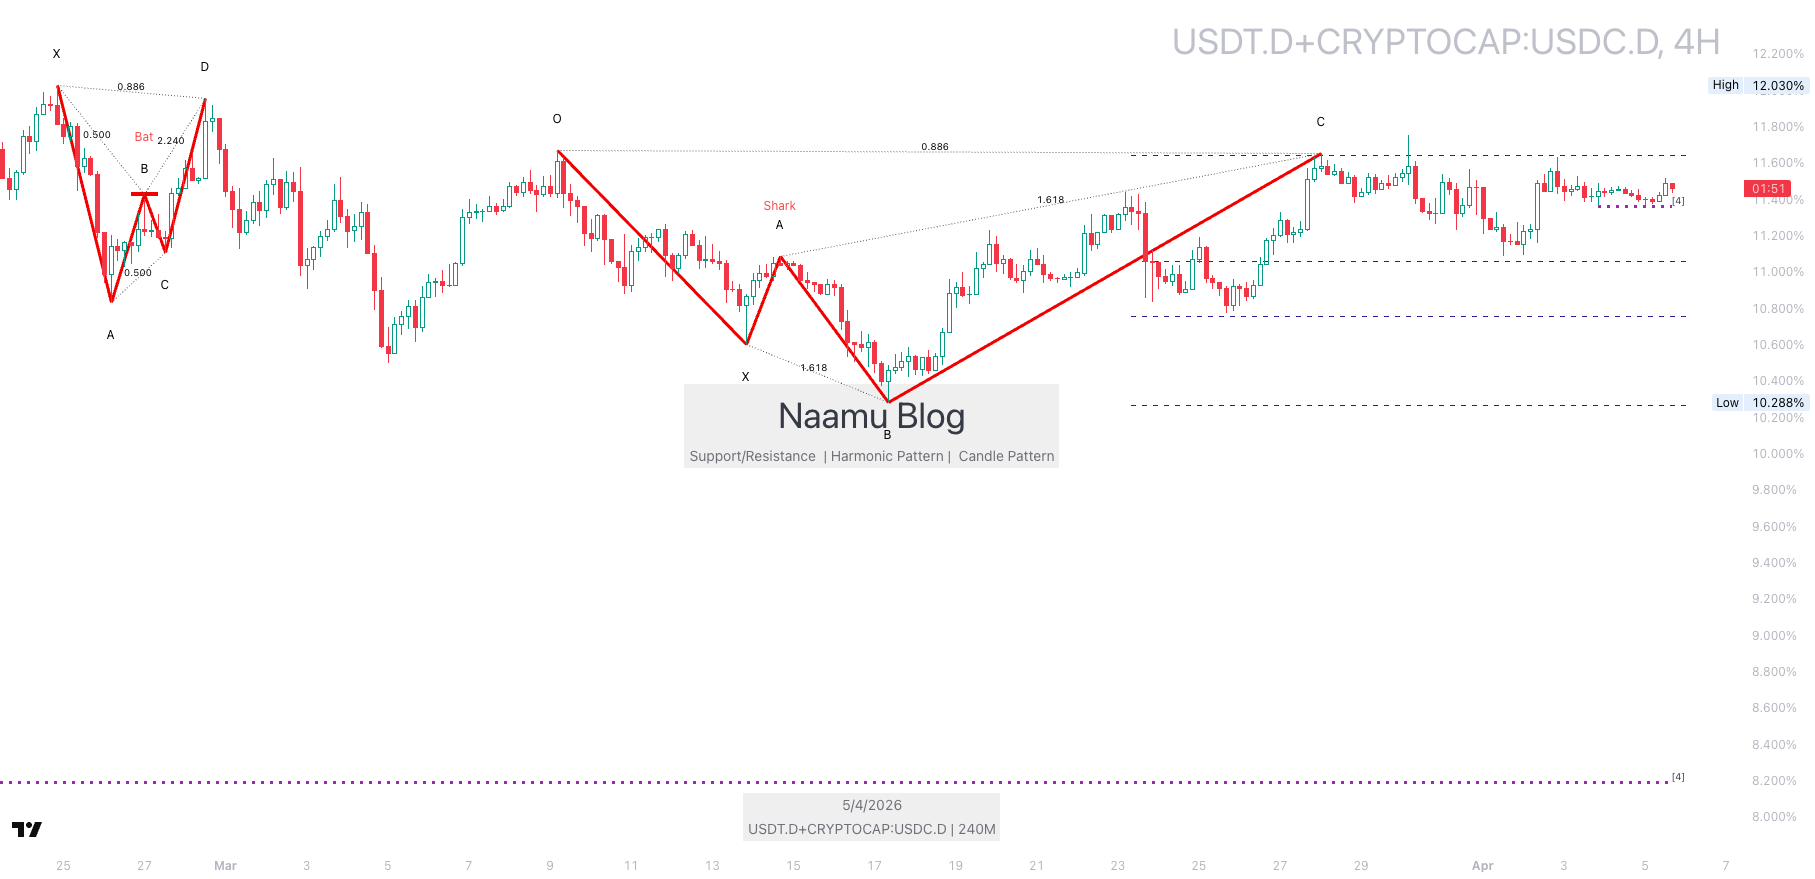 USDTD chart auxiliary shows stablecoin liquidity trends. Reference for market fund flows alongside net outflow data.
Near-term scenarios
Base case
If BTC continues consolidating in the $67,000~$77,000 range, with DXY’s bullish reversal pattern and exchange net outflows maintaining conflicting signals, the market will remain in a mixed phase. Direction will stay uncertain until a confirmed break above $77,000 resistance or below $67,000 support.
Alternative case
If DXY shows strength exerting downward pressure on BTC, or geopolitical news shakes the market, BTC could retest the $67,000 support. Conversely, if ETF inflows increase or positive news breaks the $77,000 resistance, short-term upward momentum may form.
Checklist
- Monitor BTC $77,000 resistance break
- Watch DXY test of 99.500 resistance
- Check persistence of exchange net outflow trend
- Look for improvement signals in Fear & Greed Index
Related reads
How to read DXY-Bitcoin correlation A guide to reading BTC funding rates Reading the market with on-chain data
FAQ
How does DXY’s bullish reversal pattern affect BTC?
DXY’s bullish reversal pattern suggests dollar strength, which generally acts as downward pressure on BTC. However, it shouldn’t be concluded in isolation; it must be judged comprehensively with other indicators.
Why is exchange net outflow important?
Exchange net outflow (-18,057 BTC) indicates investors are moving BTC off exchanges for long-term holding, interpreted as a signal of reduced spot selling pressure. But combined with ETF outflows, it presents mixed signals.
What does Fear & Greed Index 13 (Extreme Fear) mean?
Fear & Greed Index 13 indicates extreme fear in market sentiment, which historically can act as a rebound zone but suggests short-term volatility potential. Risk management is advised when investing.
Related Posts

Newsletter
Weekly Quant & Market Insights
Get market analysis, quant strategy ideas, and AI & data tool insights delivered to your inbox.
Subscribe →