Bitcoin Breaks 72K as Ceasefire News and Stablecoin Trials Add Momentum
The Middle East ceasefire and Swiss bank stablecoin experiments improved risk sentiment. On April 8, Bitcoin moved above 72K and shifted into a momentum test rather than a simple range trade.
Why this matters today
Bitcoin’s break above $72,000 is a technical breakout testing the 7-day range high ($66,794~$72,111), confirming short-term upward momentum.
Geopolitical news like the ceasefire reduces market uncertainty, tending to improve investor sentiment toward risk assets.
Exchange net outflows and positive momentum reflect accumulation psychology and short-term rebound expectations among market participants.
Bitcoin: reading the main chart
72K Breakout and Shark Pattern Suggest Short-Term Bullish Reversal
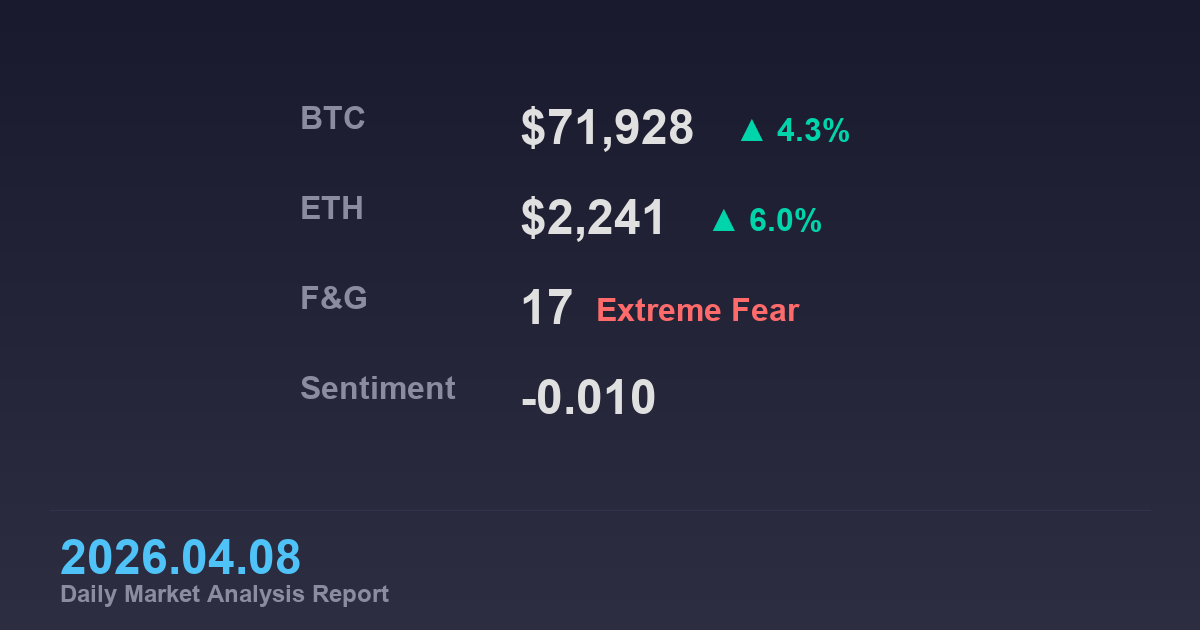
Bitcoin is currently around $71,928, breaking above the $72,000 level, which is the top of its 7-day range ($66,794~$72,111), showing upward momentum. This represents a 4.3% increase from yesterday’s $68,937, indicating strong rebound pressure in the short term.
Chart analysis shows the overall structure forms a Head & Shoulders pattern indicating a downtrend, but recent price action is sideways. Notably, a short-term Shark harmonic pattern is forming a bullish reversal structure from point A to X. This pattern sets key resistance at $76,000 and $78,000, with support at $66,000, $61,618, and $61,300, suggesting the $72,000 breakout could be a starting point for an upward test.
From a technical perspective, the $72,000 breakout is a move above the 7-day high, interpreted as a confirmation signal for short-term upward trend. However, the $76,000 resistance is nearby, which may act as a brake on further gains, while support below $66,000 remains a long-term downside risk.
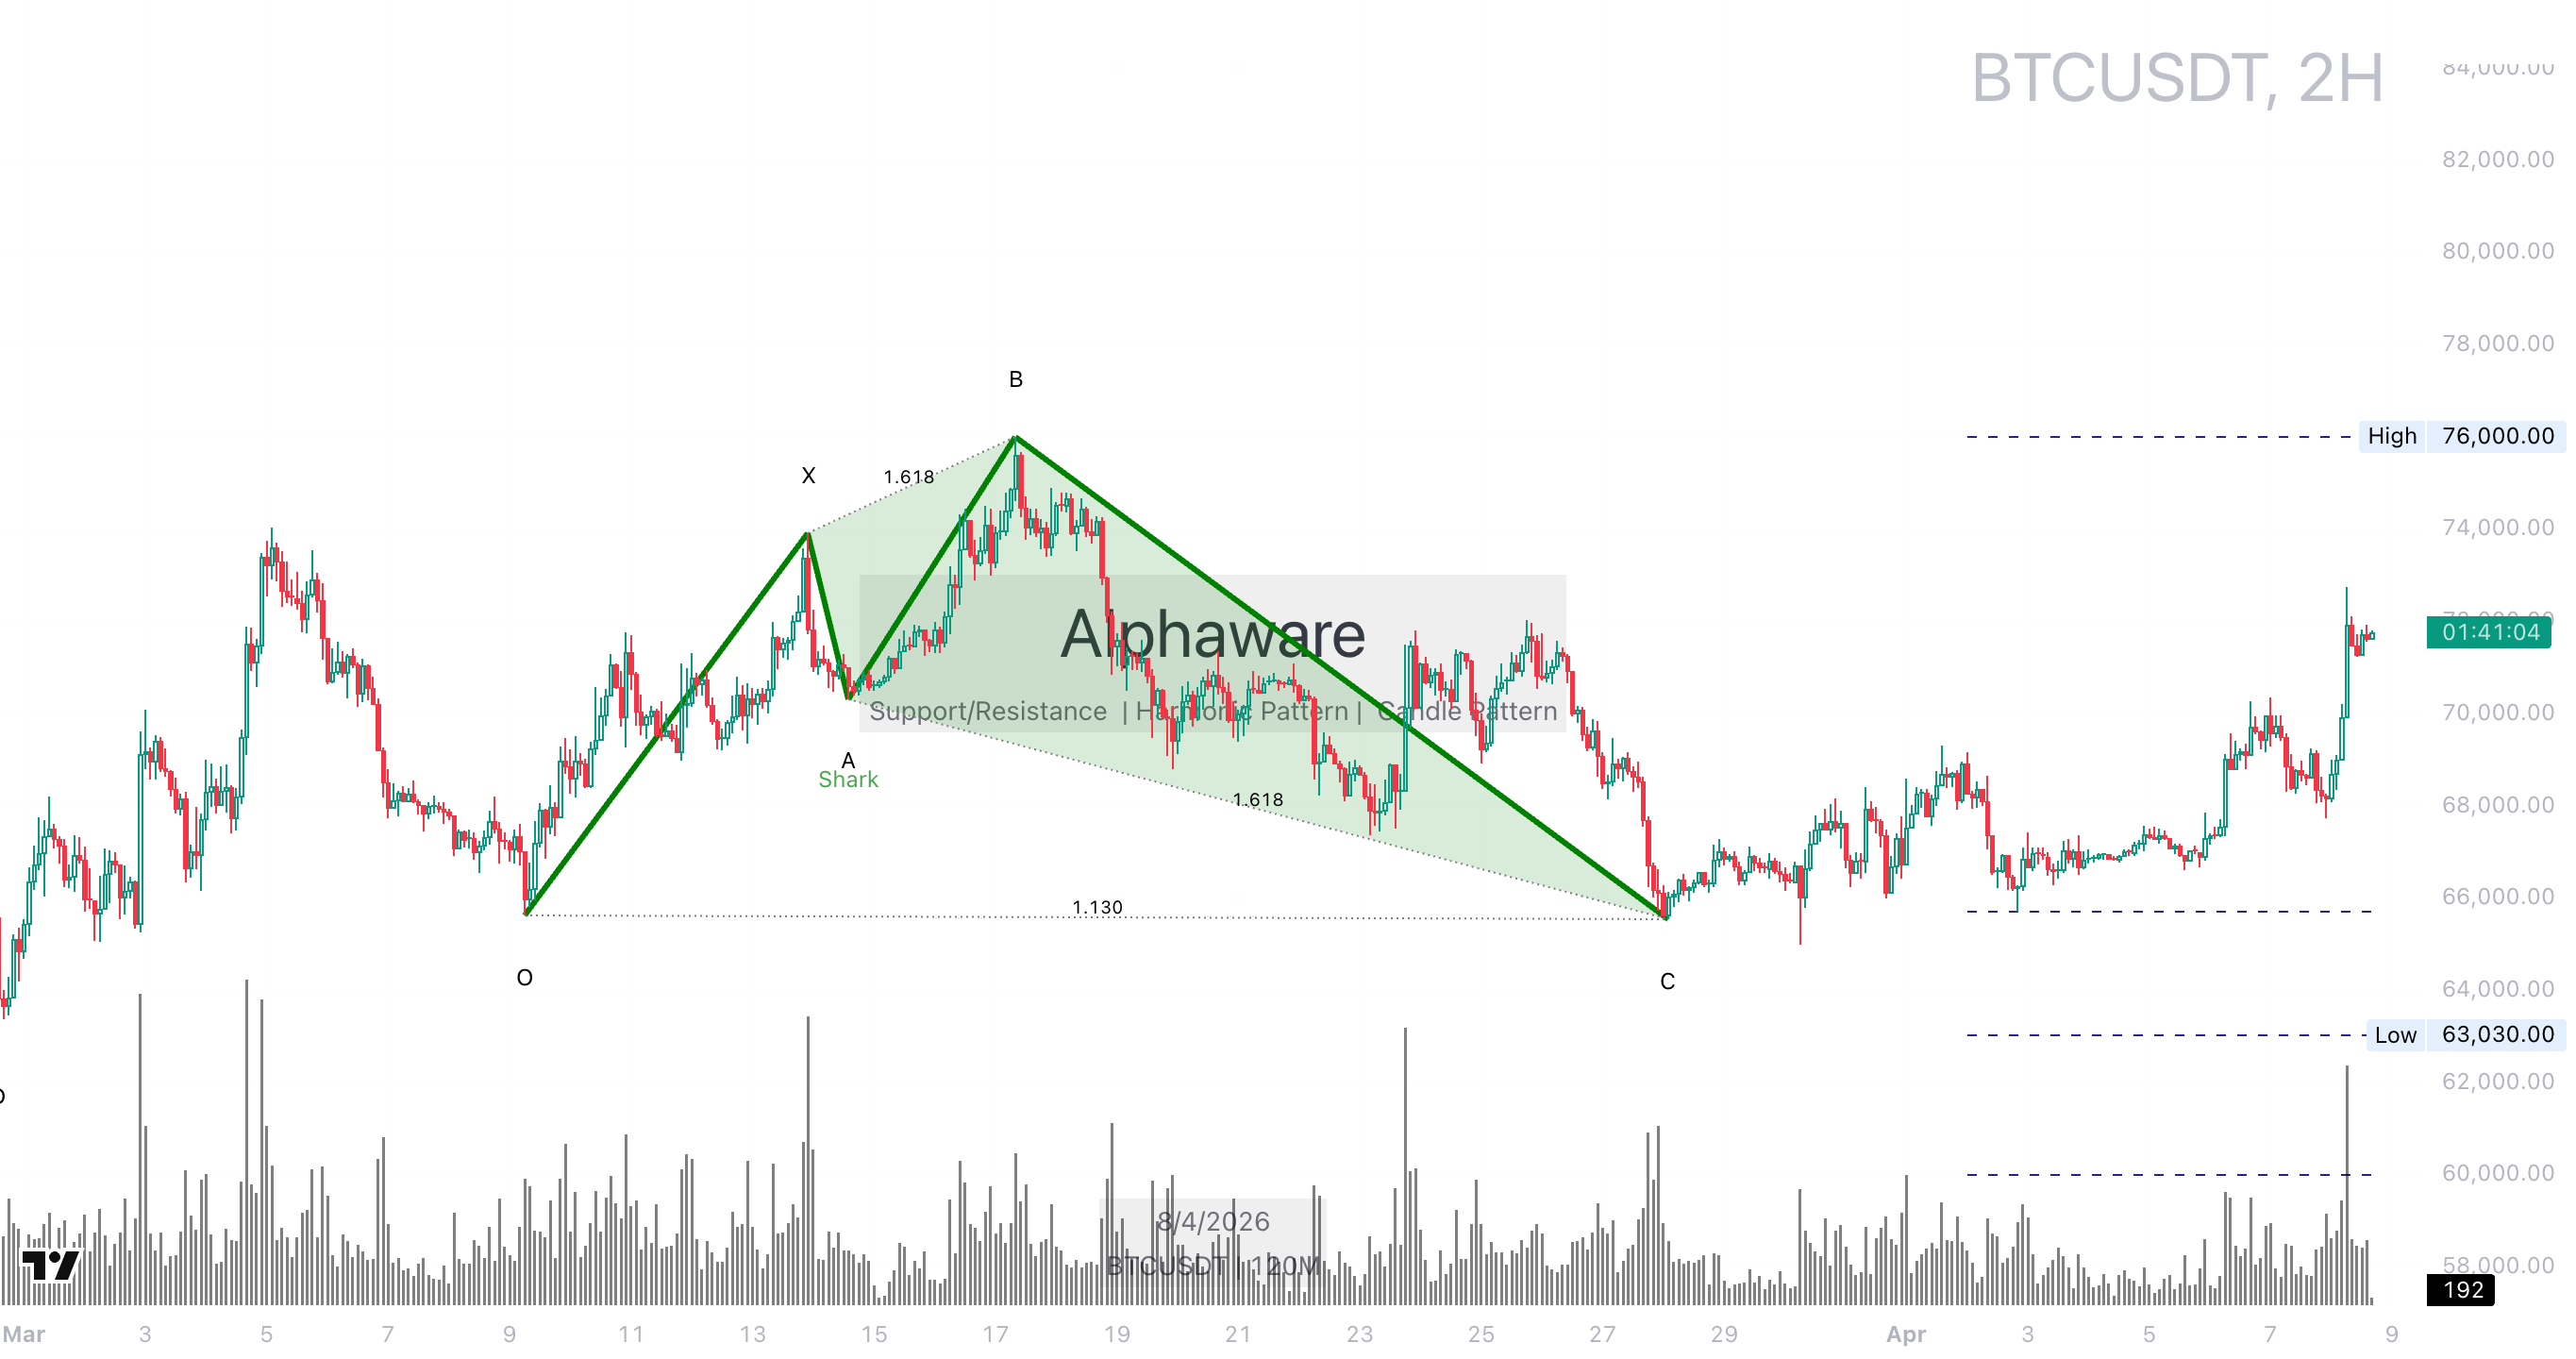 BTC breaks $72,000 with a short-term Shark pattern suggesting bullish reversal, highlighting $76,000~$78,000 as next resistance levels.
Cross-asset confirmation
DXY Crab Pattern Signals Bullish Reversal, but Overall Downtrend Limits Impact
DXY (Dollar Index) is in a downtrend but shows a Crab harmonic pattern forming a bullish reversal structure on the chart. With a reliability of 0.85, this suggests short-term rebound potential, with key resistance at 100.643 and 0.707, and support at 0.618 and 0.3140.
While DXY strength typically pressures crypto downward, its overall downtrend may limit the impact of the Crab pattern. That is, even if DXY rebounds short-term, pressure on the crypto market could be mitigated. Additionally, ETH is at $2,241, up 6.0%, showing optimistic signals, and SPX is mentioned as bullish, indicating a favorable global risk asset environment.
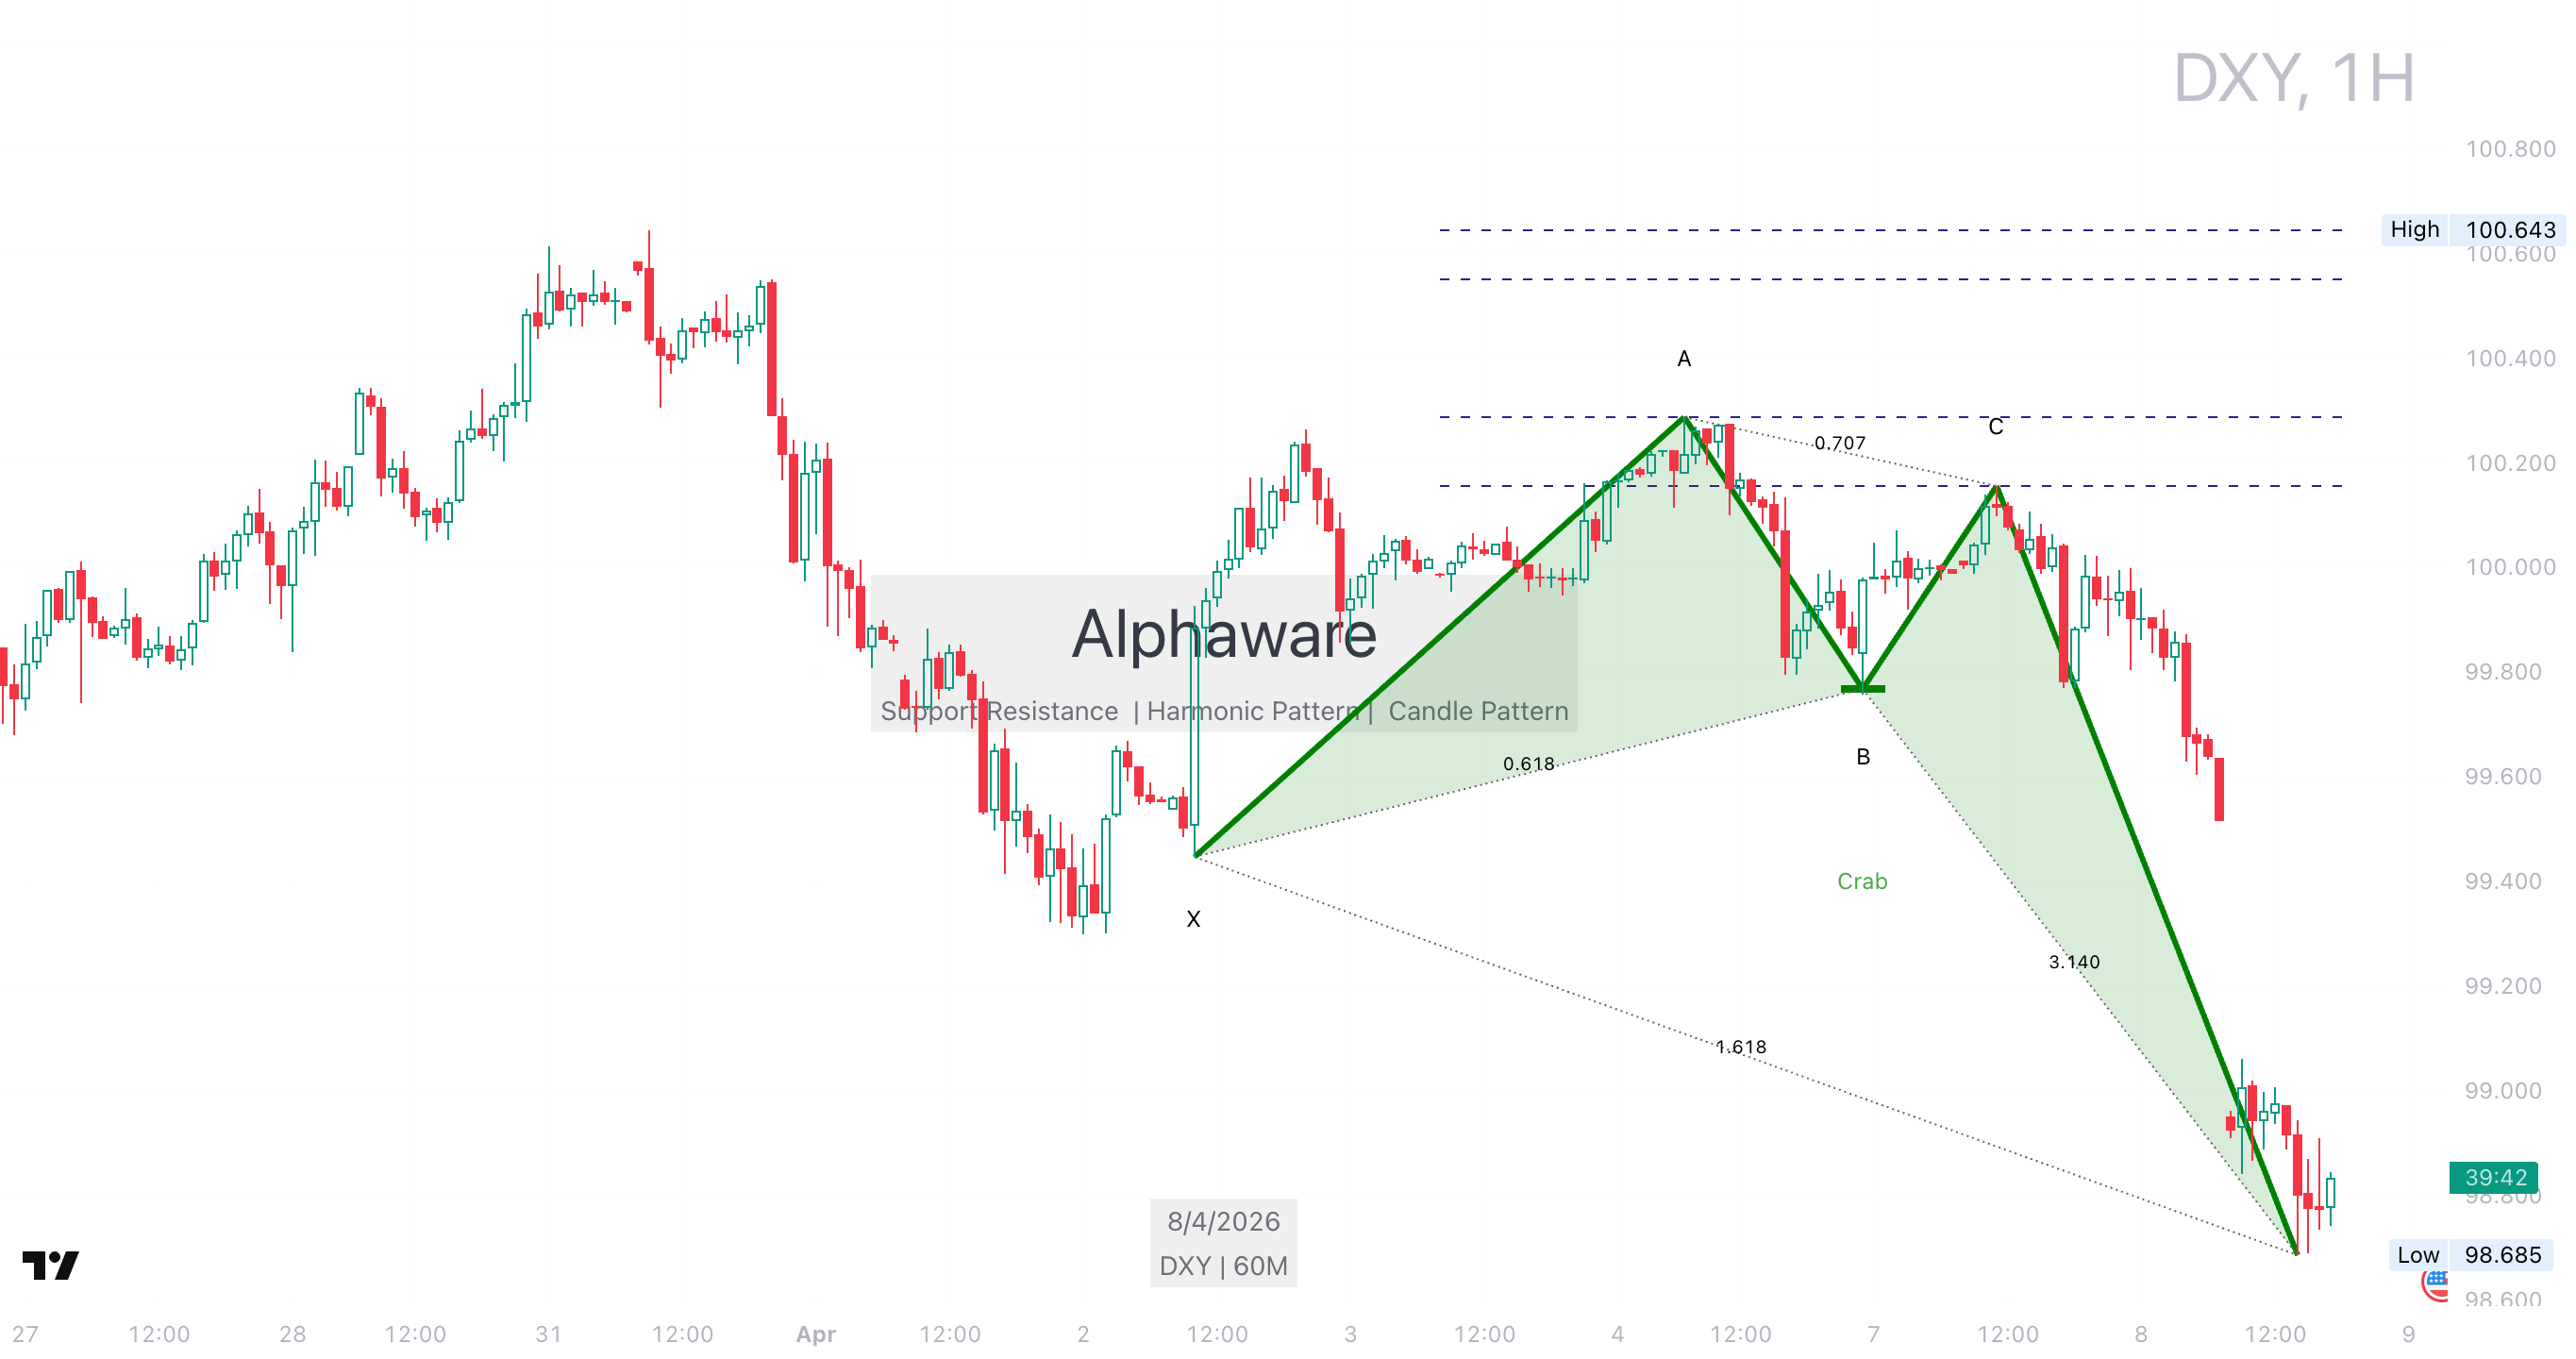 DXY shows a Crab pattern for short-term bullish reversal, but overall downtrend may limit pressure on crypto.
Macro and major headlines
Middle East Ceasefire and Stablecoin News Contribute Positively to Market Sentiment
Today’s major news highlights the Middle East ceasefire agreement. According to WatcherGuru and unusual_whales, the US and Iran agreed to a two-week ceasefire, fully reopening the Strait of Hormuz, confirmed by the Pakistan Prime Minister’s announcement. Such geopolitical de-escalation reduces market uncertainty, potentially positively impacting risk assets like crypto.
Additionally, a high-impact event of scale 6 reports that UBS and five major Swiss banks are testing a Swiss franc crypto stablecoin. This suggests increasing institutional adoption of crypto and could be a long-term positive for market confidence. Other events include reports of $150 billion flowing into the crypto market in 24 hours and Ethereum stablecoin supply hitting an all-time high, showing overall high liquidity and interest.
Sentiment analysis shows mixed signals with BTC at -0.033, ETH at +0.023, macro at -0.025, and overall at -0.010, but the momentum indicator at +0.0364 leans toward rebound, supporting short-term upward pressure.
| Indicator | Current read | Market implication |
|---|---|---|
| BTC Price | $71,928 (+4.3%), 7-day range $66,794~$72,111 | 72K breakout confirms short-term upward momentum, potential for further testing |
| Fear & Greed Index | 17 (Extreme Fear) | Extreme fear heightens rebound expectations, but cautious approach needed |
| Exchange Net Outflow | -18,057 BTC (7-day) | Eases spot selling pressure, reflects long-term holding sentiment |
Table data is based on real-time values as of April 8, 2026, for reference in interpreting short-term market trends.
On-chain and derivatives
Exchange Net Outflows and Funding Rates Support Upward Momentum
On-chain data shows BTC exchange net outflow at -18,057 BTC over 7 days, suggesting eased spot selling pressure and strengthened long-term accumulation sentiment. In contrast, BTC ETF net inflow is $-24 over 7 days, a minor burden in the overall fund flow.
On the derivatives side, BTC funding rate is 0.0060%, higher than the 7-day average of 0.0021%, indicating increased demand for short-term long positions. ETH funding rate is 0.0000%, neutral. The USDTD 4h USDCD chart provides auxiliary data on stablecoin liquidity, but key insights come from net outflows and funding rates.
In summary, fund flows support upward momentum with exchange net outflows and rising funding rates, reflecting optimistic outlooks among market participants.
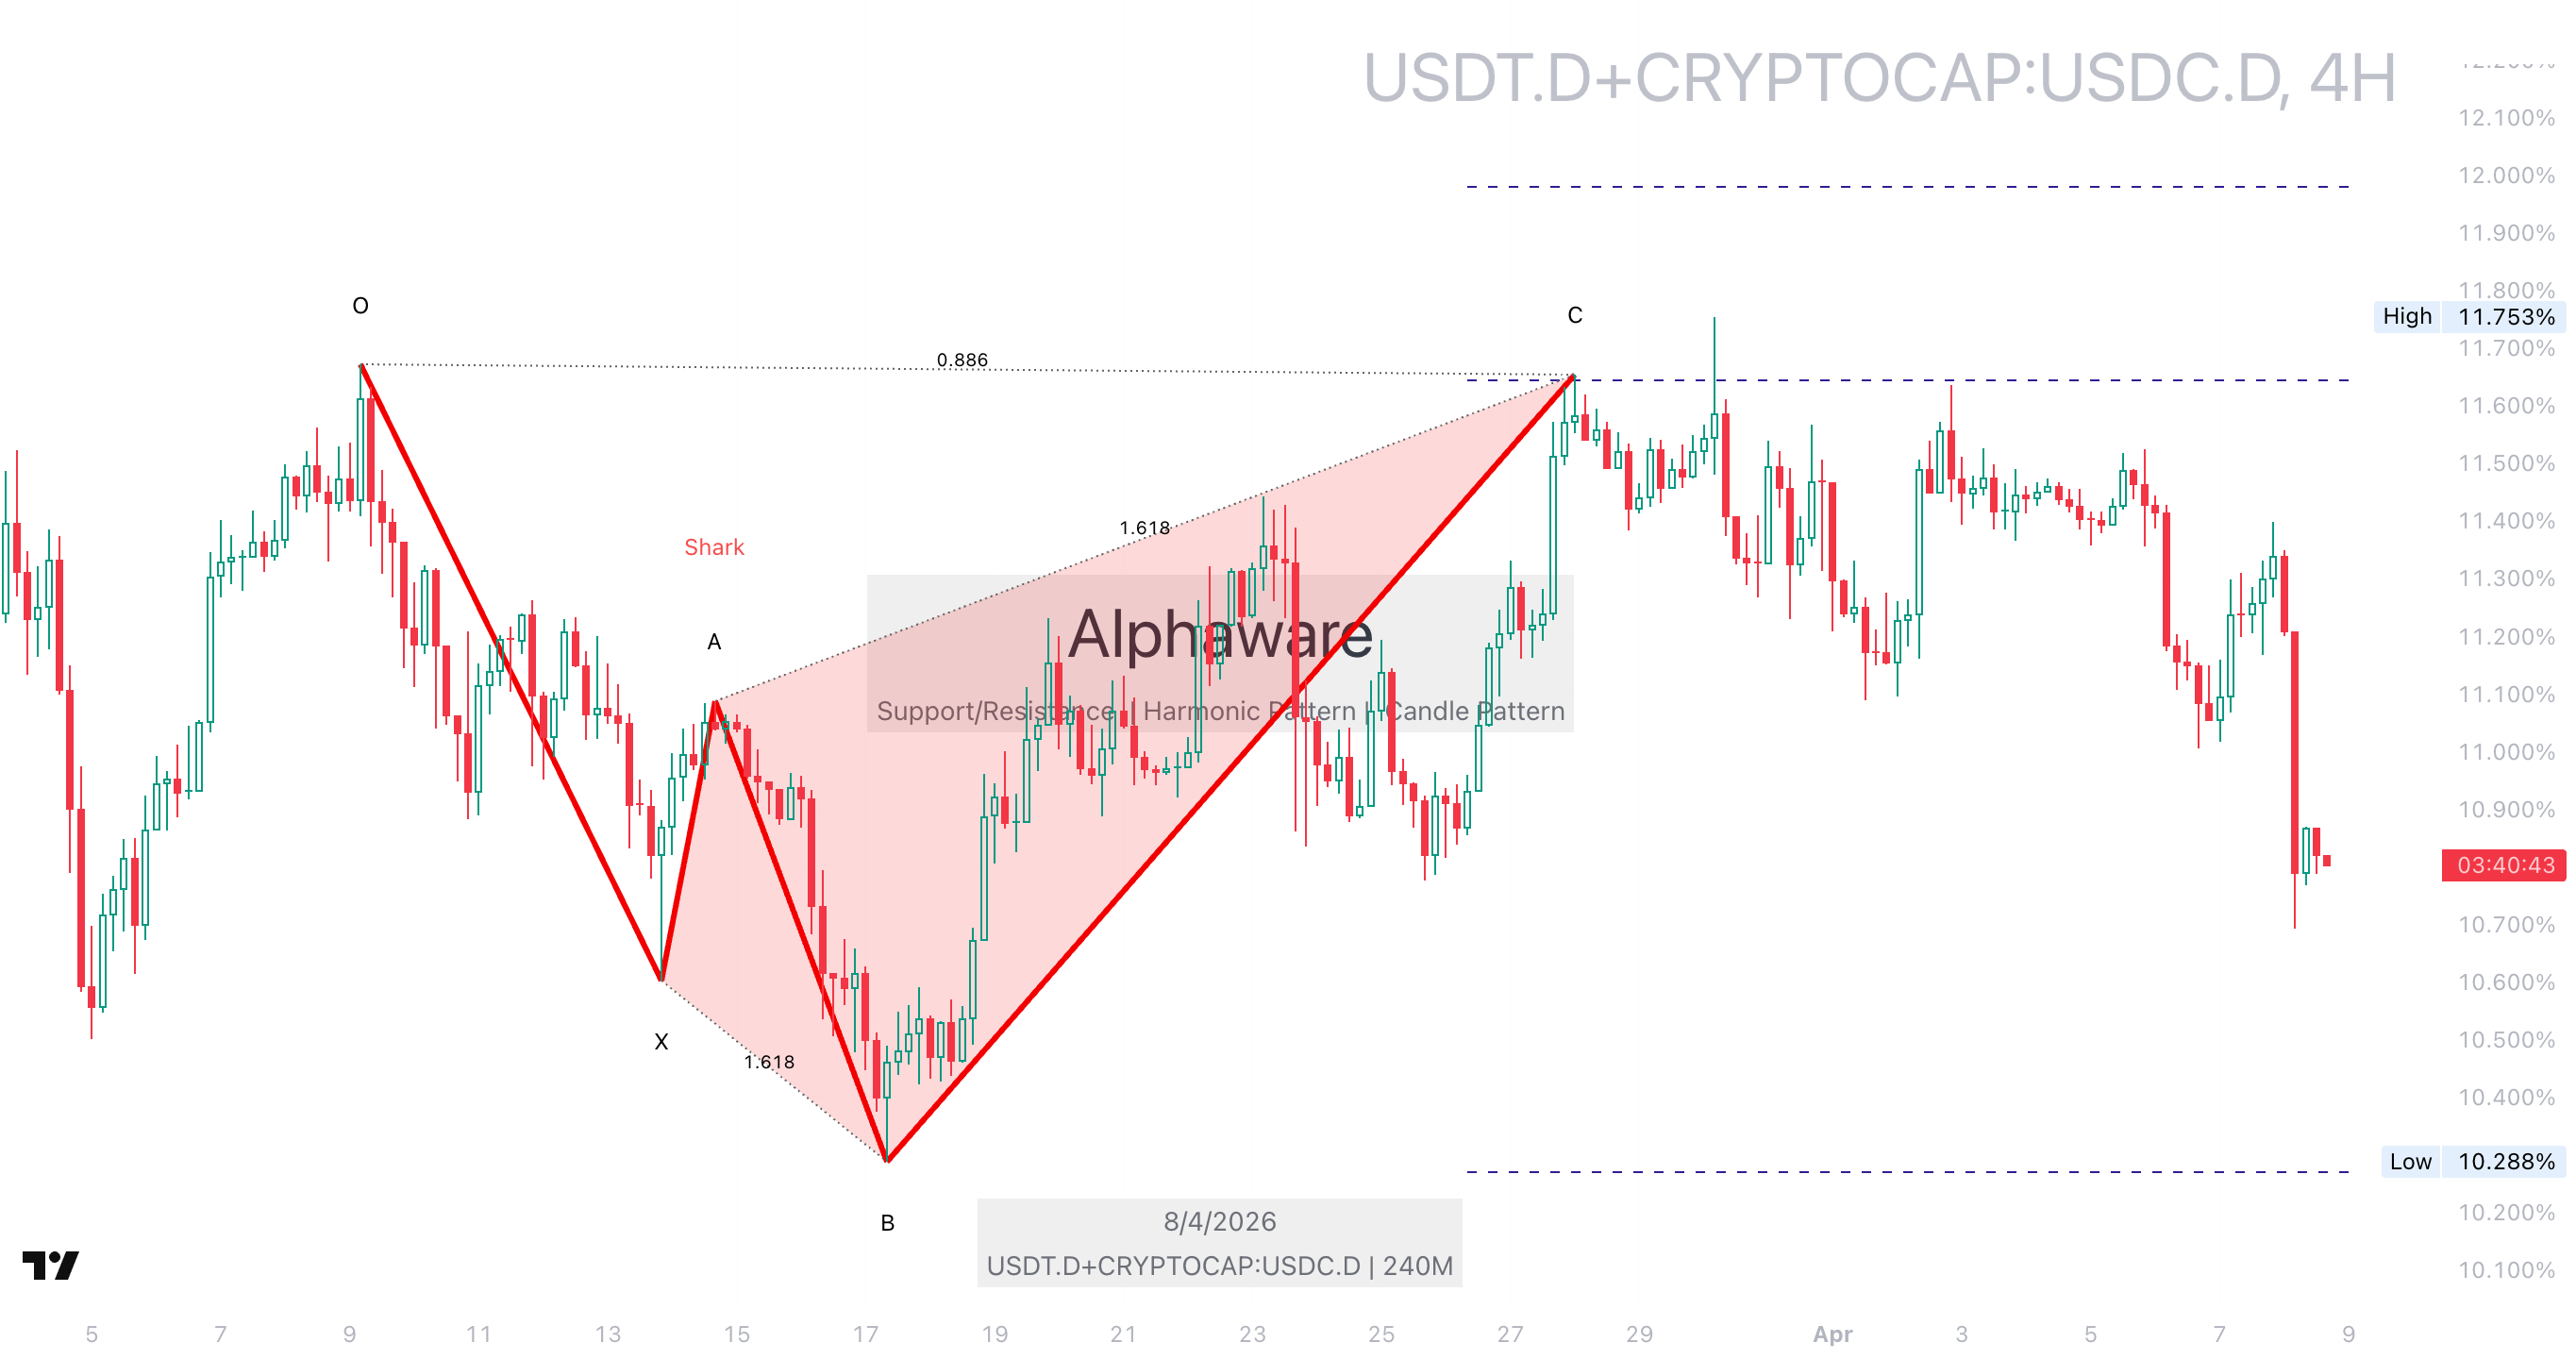 This chart provides auxiliary data on stablecoin liquidity, with key insights derived from exchange net outflows and funding rates.
Near-term scenarios
Base case
If Bitcoin maintains its $72,000 breakout, supported by the short-term Shark pattern and positive news, it could test the $76,000~$78,000 resistance levels and continue its rebound, with exchange net outflows and momentum indicators providing support.
Alternative case
If the $72,000 breakout proves false and DXY rebounds more strongly than expected, applying pressure, Bitcoin could retreat to the $66,000 support level and resume a sideways phase, with ETF outflows potentially adding to the burden.
Checklist
- Monitor if the $72,000 breakout holds on the 4-hour chart.
- Watch the impact of DXY’s Crab pattern rebound on crypto.
- Follow up on Middle East ceasefire news and market reactions.
- Check if exchange net outflow trends continue.
Related reads
2026년 04월 07일 암호화폐 시장 분석 2026년 04월 06일 암호화폐 시장 분석 2026년 04월 05일 암호화폐 시장 분석
FAQ
Why is Bitcoin’s break above $72,000 important?
This breakout is a technical signal above the 7-day range high, confirming short-term upward trend and enhancing the reversal potential of the Shark pattern. It can serve as a stepping stone for further gains, supported by favorable momentum and fund flows.
How does DXY’s Crab pattern affect crypto?
The Crab pattern suggests a short-term bullish reversal for DXY, but since DXY is in an overall downtrend, its pressure on crypto may be limited. That is, a limited DXY rebound is unlikely to halt crypto gains.
What impact did today’s news have on the market?
The Middle East ceasefire agreement reduced geopolitical uncertainty, improving risk asset sentiment, while Swiss bank stablecoin trial news suggests increasing institutional adoption, acting as a long-term positive for market confidence. Both contributed positively to market sentiment.
Related Posts
Newsletter
Weekly Quant & Market Insights
Get market analysis, quant strategy ideas, and AI & data tool insights delivered to your inbox.
Subscribe →