What Is Quantitative Investing? A Beginner's Guide for Individual Investors
Learn what quantitative investing is, whether individuals can do it, and where to start. Your first step toward data-driven investing instead of relying on intuition.

What Is Quant Investing?
Quant (Quantitative) investing is a method of making investment decisions based on numbers and data. Instead of gut feeling or news, you analyze historical data to define rules, then trade according to those rules.
Here’s an example:
“Buy when the 20-day moving average crosses above the 60-day moving average, and sell when it crosses below.”
You apply this rule to 10 years of historical data and check whether it would have generated profit. This process is called backtesting. If the backtest shows a profit, applying it to live trading is the basic flow of quant investing.
How Is It Different from Intuition-Based Investing?
| Aspect | Intuition-Based | Quant Investing |
|---|---|---|
| Trade criteria | ”Feels right” | Defined rules |
| Emotional involvement | High | None (rule-based) |
| Verification | None | Validated via backtest |
| Reproducibility | Impossible | Same results every time |
| Time required | Must watch charts daily | Can be automated |
The biggest difference is verifiability. You can objectively confirm “did this strategy work in the past?”
Can Individual Investors Do This?
Yes, they can. Quant investing used to be the exclusive domain of large hedge funds, but the environment has completely changed.
Free tools available today:
- Data: Free price data from Yahoo Finance, Binance API, and others
- Analysis tools: Python + pandas (free)
- Backtesting: Backtrader, QuantConnect (free plans)
- Trade automation: Korea Investment & Securities API, Binance API (free)
- Charts: TradingView (free plan)
If you know programming, Python is the best choice. If coding is a barrier, no-code tools like Quantiwise are also available.
The Basic Workflow of Quant Investing
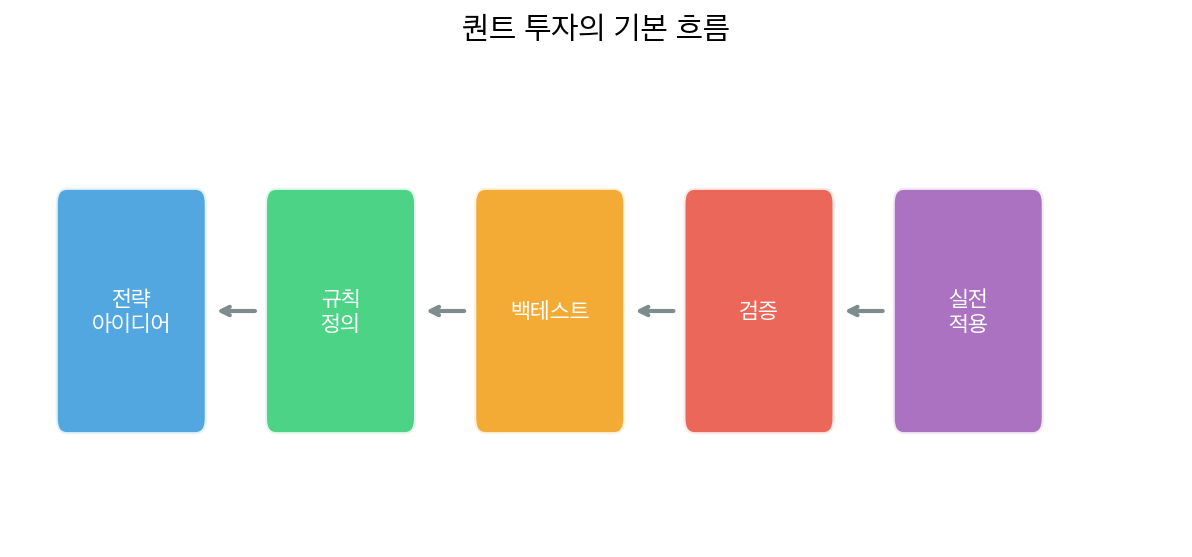
① Strategy idea → ② Define rules → ③ Backtest → ④ Validate → ⑤ Live trading① Strategy Idea
Decide “under what conditions will I buy and sell?” Start with something simple.
- Moving average crossover (golden cross / death cross)
- Buy when RSI is below 30, sell when above 70
- Enter when volume is more than 2x the average
② Define Rules
Turn the idea into concrete rules with no ambiguity.
“If the 20-day moving average crosses above the 60-day moving average, buy 100% of capital at the next day’s open. If it crosses below, sell everything.”
③ Backtest
Apply the rules to historical data and check the return. In Python, it looks something like this:
import pandas as pd

# Load price data
df = pd.read_csv("btc_daily.csv")

# Calculate moving averages
df['ma20'] = df['close'].rolling(20).mean()
df['ma60'] = df['close'].rolling(60).mean()

# Generate signals
df['signal'] = 0
df.loc[df['ma20'] > df['ma60'], 'signal'] = 1   # Buy
df.loc[df['ma20'] < df['ma60'], 'signal'] = -1  # Sell

# Calculate returns
df['returns'] = df['close'].pct_change()
df['strategy'] = df['signal'].shift(1) * df['returns']

total_return = (1 + df['strategy']).cumprod().iloc[-1] - 1
print(f"Strategy return: {total_return:.2%}")
④ Validate
A good backtest result doesn’t mean you should immediately trade live. There are things to check:
- Out-of-sample testing: Re-validate using data that was not used in the backtest
- Include trading costs: Does it still profit after subtracting fees and slippage?
- Parameter sensitivity: Does a similar result hold if you change 20 days to 19 or 21?
Skipping this step leads to overfitting — a strategy that fits the past but fails in the future.
⑤ Live Trading
Only deploy strategies that pass validation, starting with a small amount. Begin with no more than 10% of your total capital.
Common Pitfalls in Quant Investing
Overfitting
If you fine-tune a strategy to fit historical data too closely, it won’t work in the future. Using too many parameters or repeatedly optimizing on the same data causes overfitting.
Ignoring Transaction Costs
A strategy may look profitable in theory, but once you subtract fees, many turn negative. The more frequently a strategy trades, the greater the impact of transaction costs.
Past ≠ Future
Backtesting only shows “this worked in the past.” If market conditions change, the same strategy may stop working.
What Do You Need to Learn to Get Started?
| Step | What to Learn | Time |
|---|---|---|
| Step 1 | Python basics (variables, loops, functions) | 2–4 weeks |
| Step 2 | pandas basics (data manipulation) | 1–2 weeks |
| Step 3 | Loading price data | 1–2 days |
| Step 4 | First moving average strategy backtest | 1 week |
| Step 5 | Learning validation techniques | Ongoing |
If you have no programming experience, start with Python basics. Within a month, you can run a simple backtest.
Recommended Starting Paths
Crypto quant (recommended): The Binance API is free and data access is easy. The 24-hour market also makes it easier to test strategies.
Korean equities quant: Use the Korea Investment & Securities API. Market hours are limited and data access is more complex than crypto.
US equities quant: Free data is available from Yahoo Finance.
Whichever market you choose, the core principle is the same: define rules, validate them, and start small.
Related Posts
Backtest Overfitting Prevention: Walk-forward vs Purged K-Fold Comparison
What to Look at Before IC When Combining Factors
Getting Started with Python Backtesting: How to Validate Your First Trading Strategy
Related Posts
Newsletter
Weekly Quant & Market Insights
Get market analysis, quant strategy ideas, and AI & data tool insights delivered to your inbox.
Subscribe →